
 ChatGPT
 Perplexity

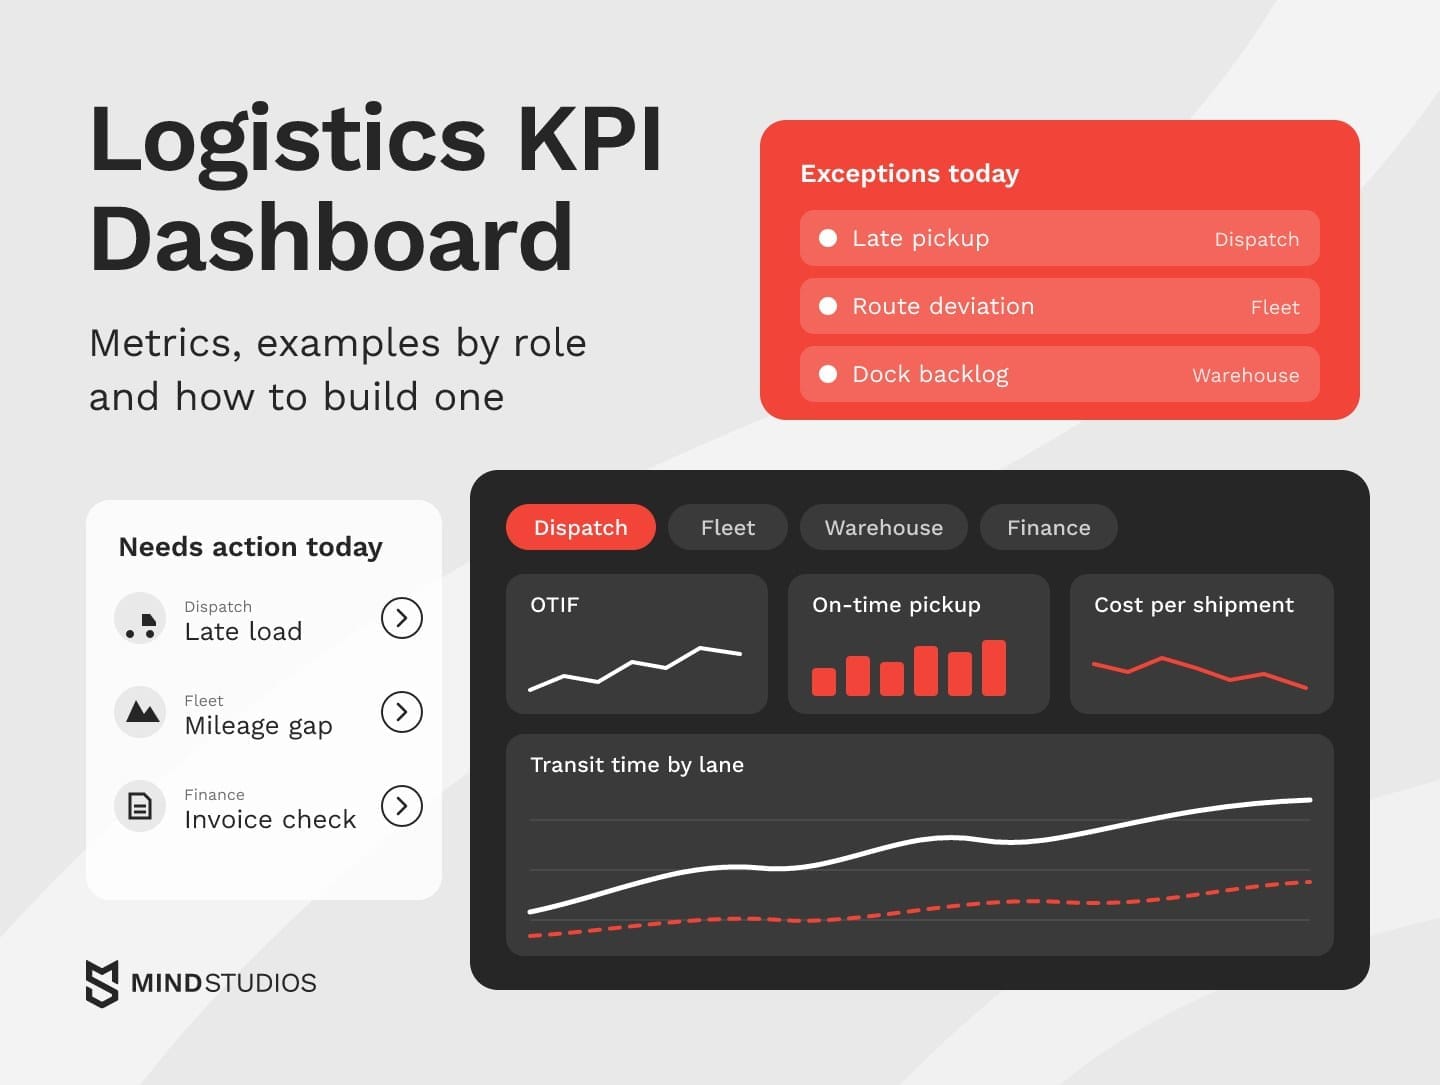
A logistics KPI dashboard is a logistics dashboard that puts the metrics each role acts on in one place. This guide covers which KPIs to track, each role's screen, data sources and when Excel, BI or custom software fits.
Highlights
- Choose KPIs from the decisions each role makes, five to seven per screen.
- Shared KPI definitions and clean source data matter more than chart design.
- BI over clean data often suffices; custom pays off when workflows outgrow it.
Your delivery data may sit in a TMS, stock in a WMS, costs in the ERP and vehicle data in a telematics portal. Someone probably stitches them together in a spreadsheet every Monday, and by then the late loads and overcharged lanes it reveals are already history.
We've built role-based dashboards inside a fleet operations platform for OÖ Medienlogistik, and we moved our own planning, HR and asset tracking from spreadsheets into an internal ERP.
Our logistics software projects start with one question: Which decisions should the screen support?
If your data is split across a TMS, WMS, ERP and spreadsheets and you're deciding what the first screen should show, those decisions are worth working through before anyone draws a chart.
What is a logistics dashboard?
A logistics dashboard is a single screen that brings all the important data into one place: delivery status, costs, fleet and warehouse figures pulled from your operational systems. It refreshes on a set schedule and flags whatever has drifted from plan, so each team sees what to act on today.
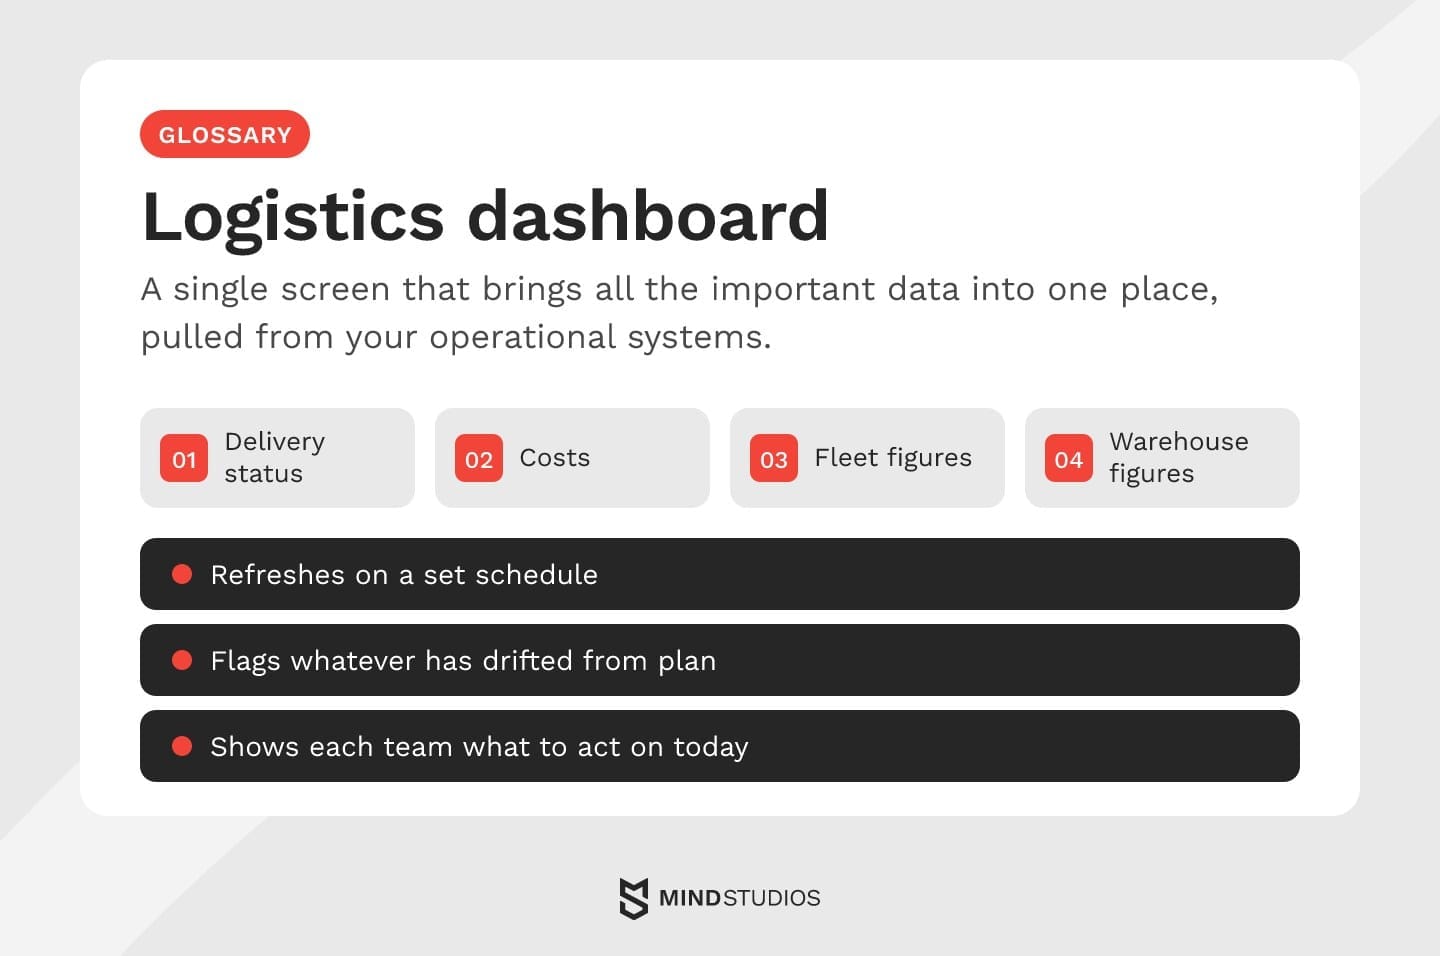
A KPI dashboard narrows that screen to indicators tied to targets. A monthly report tells you on-time delivery fell last month. The dashboard shows which lane is slipping this morning and lets a manager drill down to the shipments behind the number.
Four dashboard types organize the same data around different decisions:
- Operational: live shipments, exceptions and dock activity, refreshed every few minutes.
- Tactical: weekly carrier, lane and route performance for operations managers.
- Analytical: historical data for finding the cause behind a trend.
- Strategic: monthly cost, service and capacity trends for leadership and the board.

Why logistics dashboards matter once operations outgrow spreadsheets
A dashboard matters because a logistics problem is cheaper to fix the earlier someone sees it. When data sits in five systems, managers often learn about a late load or a wrong charge from the invoice, a customer complaint or a payroll dispute.
Detours and idle hours seen daily in telematics data become plan changes on lanes that are still running, while the invoice can only settle the charge after the trip.
The stakes add up: ATRI's latest cost analysis put 2025 truck operating costs at $2.336 per mile, so each unplanned detour or idle hour cuts straight into the margin.
The usual signs that spreadsheets no longer keep up:
- Dispatchers checking three systems every morning.
- Analysts rebuilding the same weekly summary by hand.
- Couriers disputing mileage-based pay.
In each case the data exists but arrives too late. With logistics KPIs on one screen, warehouse, fleet and supplier teams share the same numbers, and customers can hear about delays from you first.
What a logistics dashboard should show
A useful screen shows exceptions first: the shipments, vehicles and orders that need a decision today. Shipment status, cost by lane, service levels and billing come next, because they explain the trend behind those exceptions. Put today's decisions on top and keep supporting trends one click away.
If dispatchers open it at 6 a.m., the top row should list late pickups, route deviations and failed deliveries. Below that, the screen groups into service, cost and control:
- Service: delivery times, order accuracy and supplier performance against agreed windows.
- Cost and assets: transportation cost per mile, fleet efficiency, warehouse performance and inventory turnover.
- Control: real-time alerts on exceptions and dashboard integration with the TMS, WMS and ERP behind each number.
Each exception should link to its source record and a named owner, which is why the next section pairs every formula with an owner.
Logistics KPI dashboard: the metrics worth tracking
Group logistics KPIs by the decision they support: delivery, cost, carriers, fleet, warehouse and customer. For each one, fix how it's calculated, where the data comes from, who owns it and what happens when it slips. Set targets from your own baseline, since a universal percentage says little about your network.
How each KPI is calculated and where the data comes from
The first table shows our working definitions, which each client adapts to its contracts. Two teams with different denominators for on-time delivery can spend the review arguing whose number is right.
| KPI (category) | How it's calculated | Data source |
|---|---|---|
| On-time delivery (delivery) | On-time deliveries ÷ deliveries due in the period; open past-due loads count as late | TMS, proof of delivery |
| OTIF (delivery) | Order lines due in the period delivered complete within the confirmed window ÷ order lines due | ERP order lines, proof of delivery |
| On-time pickup (delivery) | Pickups due that happened within the agreed window ÷ pickups due | TMS, carrier status updates |
| Transit delay (delivery) | Share of loads arriving after planned transit time plus tolerance; median delay per lane | TMS, telematics or carrier tracking |
| Cost per shipment (cost) | Linehaul, fuel, accessorials and handling ÷ shipments | ERP, freight invoices |
| Cost per mile (cost) | Total operating cost ÷ miles driven | ERP, telematics |
| Accessorial spend (cost) | Detention, layover and other extra charges ÷ total freight spend | Freight invoices |
| Carrier on-time delivery (carriers) | The on-time delivery cohort split by carrier, open past-due loads included | TMS, carrier API or EDI |
| Tender acceptance rate (carriers) | Loads accepted ÷ loads tendered, per carrier | TMS |
| Vehicle utilization (fleet) | Hours on assigned work ÷ hours the vehicle was available | Telematics, dispatch plan |
| Idle time and fuel per mile (fleet) | Stationary engine-on hours ÷ engine-on hours; fuel used ÷ miles | Telematics, fuel cards |
| Maintenance downtime (fleet) | Hours out of service ÷ planned operating hours | Maintenance log, telematics |
| Dock-to-stock time (warehouse) | Median hours from unloading to stock available for picking | WMS scans |
| Picking accuracy (warehouse) | Order lines picked correctly ÷ order lines picked | WMS, returns and claims |
| Inventory turnover (warehouse) | Cost of goods sold ÷ average inventory value, same period | ERP, WMS |
| Claims rate (customer) | Shipments with damage, loss or shortage claims ÷ shipments | Claims log, CRM |
| Emissions per shipment (customer) | Fuel used × emission factor, allocated to shipments by tonne-km, by mode | Telematics, fuel cards, carrier data |
Four of these definitions need extra rules before two teams can compare results.
Rules to settle for OTIF, transit time, cost and emissions
OTIF is stricter than on-time delivery because it also requires the full quantity. Example settings for a distributor look like this:
- Unit: the order line, so a partial delivery fails only the short lines.
- Promised window: the delivery date confirmed when the order was accepted.
- Denominator: order lines with a confirmed date in the calendar week.
- Split shipments: a line counts as in full only if its whole quantity arrives within the window.
- Exclusions: delays caused by a customer change, logged with a reason code.
Transit delay counts only late arrivals, because a signed average lets early loads cancel out late ones and hide a failing lane.
Cost per shipment needs the same care: decide whether accessorials, fuel surcharges and handling sit inside it, or the figure will shift every time finance moves a charge. For emissions, allocating each trip's total to its shipments by tonne-km makes heavy loads carry their share. Record whether the factor covers fuel production as well as combustion, with its source and version, so quarters stay comparable.
Who owns each KPI and what happens when it slips
The second table assigns each KPI an owner, a review cadence and a first action.
| KPI | Owner and cadence | If it slips |
|---|---|---|
| On-time delivery | Operations manager, daily | Find the lanes and carriers behind late loads |
| OTIF | Customer service lead, daily | Find the customers and lines behind the drop |
| On-time pickup | Dispatcher, real time | Call the carrier or reassign the load |
| Transit delay | Operations manager, daily | Review routes and hand-offs on repeat-delay lanes |
| Cost per shipment | Finance controller, weekly | Split by component to find what moved |
| Cost per mile | Fleet manager, weekly | Check empty miles, detours and fuel use by vehicle |
| Accessorial spend | Finance and procurement, weekly | Dispute invalid charges, fix detention causes with sites |
| Carrier on-time delivery | Procurement, weekly | Raise in carrier reviews, then shift volume |
| Tender acceptance rate | Procurement, weekly | Rebalance routing guides or renegotiate rejected lanes |
| Vehicle utilization | Fleet manager, daily | Consolidate routes or move vehicles between depots |
| Idle time and fuel per mile | Fleet manager, daily | Coach drivers, check routes with long waits |
| Maintenance downtime | Fleet manager, weekly | Move repeat-failure vehicles to planned maintenance |
| Dock-to-stock time | Warehouse shift lead, per shift | Add receiving staff or resequence inbound appointments |
| Picking accuracy | Warehouse manager, daily | Check slotting, labels and pick paths |
| Inventory turnover | Inventory planner, monthly | Review slow movers and reorder points |
| Claims rate | Customer service lead, weekly | Trace claims to the carrier, packaging or handling step |
| Emissions per shipment | Operations or sustainability lead, monthly | Shift volume to lower-emission modes where service allows |
How many KPIs fit on one screen
We recommend five to seven of these 17 KPIs per role screen, chosen from the decisions that person makes each day, with the rest one click away in drill-downs or reports.
A common starting set has five KPIs:
- OTIF
- Cost per shipment
- Transit delay
- Inventory turnover
- Picking accuracy
Each role's screen then narrows the set to its own decisions.
Logistics dashboard examples by role
One data set should feed several screens, because a dispatcher, a fleet manager and a CFO ask different questions about the same shipments. A good role screen answers its owner's first question of the day without a filter, as the table shows.
| Role | Questions for today | KPIs on screen |
|---|---|---|
| Dispatch and operations | Which loads are late or off route? | On-time pickup, transit delay, open exceptions, carrier on-time delivery |
| Fleet manager | Which vehicles are idle, overused or due for service? | Vehicle utilization, idle time and fuel per mile, maintenance downtime |
| Warehouse manager | Will today's orders ship on time? | Dock-to-stock time, outbound backlog, picking accuracy, inventory turnover |
| Leadership | Are service and cost trending the right way by customer? | OTIF by customer, cost per shipment, carrier and supplier risk |
| Finance | Do invoices and pay match the work done? | Cost per mile, accessorial spend, invoice variances, driver pay |
Only dispatch starts from shipments; the other screens regroup the same records by vehicle, shift, customer or payment.
Dispatch and operations dashboard
Dispatchers start the morning with yesterday's unresolved exceptions, each with the driver or carrier one click away. A carrier scorecard below the list shows which carrier needs a call first. Dispatchers often work from docks and the road, so the view should also run on a phone.
Fleet management dashboard
A fleet management dashboard compares planned and actual mileage per vehicle, then shows utilization, idle time, fuel per mile and maintenance downtime. Telematics keeps idle alerts close to real time, while maintenance trends read fine weekly.
If the screen grows into a full fleet product, our fleet app costs breakdown covers what shapes the budget.
Warehouse dashboard
A warehouse dashboard answers one question per shift: Will today's orders leave on time? Outbound backlog against cut-off times shows where orders are stuck, followed by dwell time of inbound loads, picking accuracy and space utilization, with inventory turnover in a monthly tab.
When the screen is part of a warehouse management system, a backlog alert can reassign pickers in the same tool.
Mind Studios' insight: Base restocking alerts on sales velocity and supplier lead times, so the reorder threshold tracks expected consumption during the lead time and the planner reviews replenishment before stock runs short.
Supply chain dashboard for leadership
Leadership reads trends over months, so a supply chain dashboard for the board shows where service commitments, capacity and delivery costs drift out of balance by customer and lane. A supply chain control tower is broader, adding live exception handling across partners.
Finance dashboard
The finance screen opens on mismatches: invoices above contracted rates, accessorials with no detention record and courier pay that differs from verified trips, each shown beside its shipment events for approval or dispute.
Where a logistics analytics dashboard gets its data
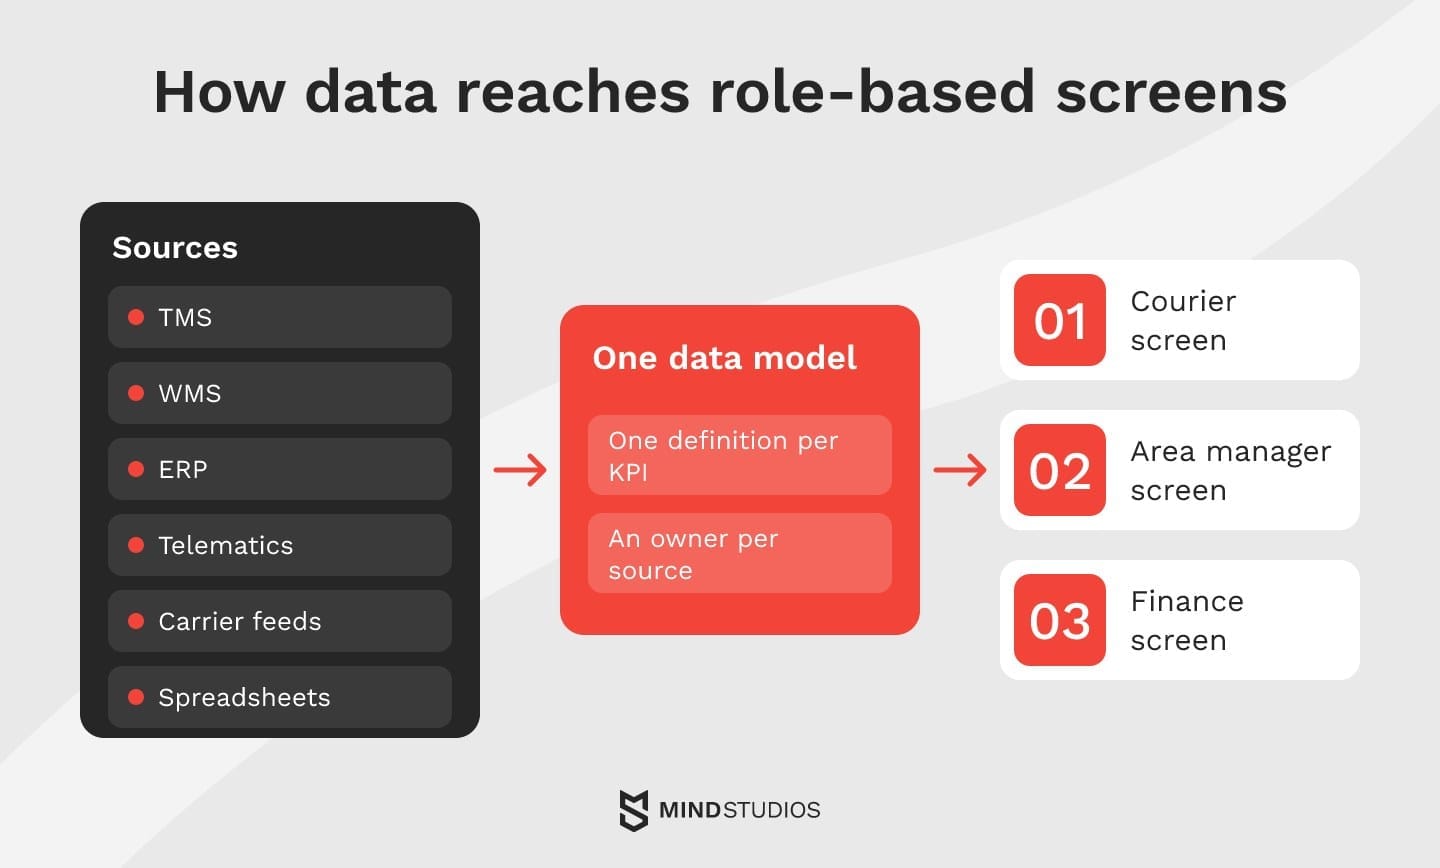
Most of the data already exists in systems you run: TMS, WMS, ERP, telematics and carrier feeds. The work is connecting them, agreeing on one definition per KPI and deciding who fixes bad records.
Which systems feed the dashboard
Six sources typically fill the KPI tables above:
- TMS: orders, loads, routes, carrier assignments and proof of delivery.
- WMS: receiving, picking, stock levels and dock activity.
- ERP: costs, invoices, payroll and customer master data.
- Telematics and GPS: location, mileage, idle time and fuel.
- Carriers and partners: status updates, tenders and invoices through API or EDI.
- Spreadsheets: rate tables, targets and anything not yet in a system.
A spreadsheet feeding a live KPI needs an owner and controlled updates, so teams can trace changes.
Shared definitions and data quality
Before any chart, the KPIs need a data model: one shipment ID across systems, one customer list, one calendar and written definitions for each metric. Without it, the TMS and the ERP can each report their own on-time figure.
Data quality needs an owner too. Assign one person per source to fix missing scans, duplicate orders and wrong carrier codes, and show a freshness stamp on every widget.
Refresh rates and access by role
Refresh frequency should follow the decision. Exceptions, pickups and vehicle positions need near-real-time updates because the window to act is short, while cost and carrier scores work fine on a daily load.
Check the refresh model of your BI tool early. Power BI's refresh limits allow up to eight scheduled refreshes a day on a Pro license and up to 48 on Premium or Fabric capacity, so minute-level exceptions need DirectQuery, streaming data or a separate alerting path.
Access works by role too: a courier sees their own trips, an area manager their region and finance pay and invoices, so permissions belong in the design from day one. Mind Studios is ISO 27001 and ISO 9001 certified, so access control is part of how we design and build from the first release.

Excel, BI tool or custom dashboard: how to choose
Excel works while one analyst keeps the data reliable and manual updates fit the review schedule. A BI tool such as Power BI, Tableau or Looker fits once data sits in reliable systems and people mainly view the numbers. Custom is worth evaluating when logistics KPIs drive multi-step approvals or mobile field work the BI stack can't support at reasonable upkeep.
How far a BI tool reaches into the workflow
Microsoft's Power Apps integration lets users act from inside a Power BI report, and Power BI data alerts on dashboard tiles can trigger a Power Automate flow when a value crosses a threshold. For a dispatcher approving one deviation at a time, that may be all the workflow a screen needs.
Test the limits early: dashboard alerts work only on card, gauge and KPI tiles and reach only the person who set them, and the Power Apps visual receives at most 1,000 records from Power BI, although the app can join other sources.
The table compares the four paths.
| Option | When it fits | Limits |
|---|---|---|
| Excel without automation | Few sources, weekly refresh, one analyst maintains it | Manual updates, file-level access, breaks when the analyst leaves |
| BI tool over existing systems | Reliable system data, read-only views, an internal data team | Refresh limits, per-user licenses as roles join, integration upkeep |
| BI plus workflow apps | Simple actions on a deviation: approve, comment, create a task | Record and sharing limits, logic scattered as steps multiply |
| Custom dashboard in your operations software | Multi-step approvals, writes to several systems, field roles on mobile | Larger upfront build, an engineering team owns it after launch |
Each step up is justified only when the current setup fails a defined requirement.
A decision path from Excel to custom
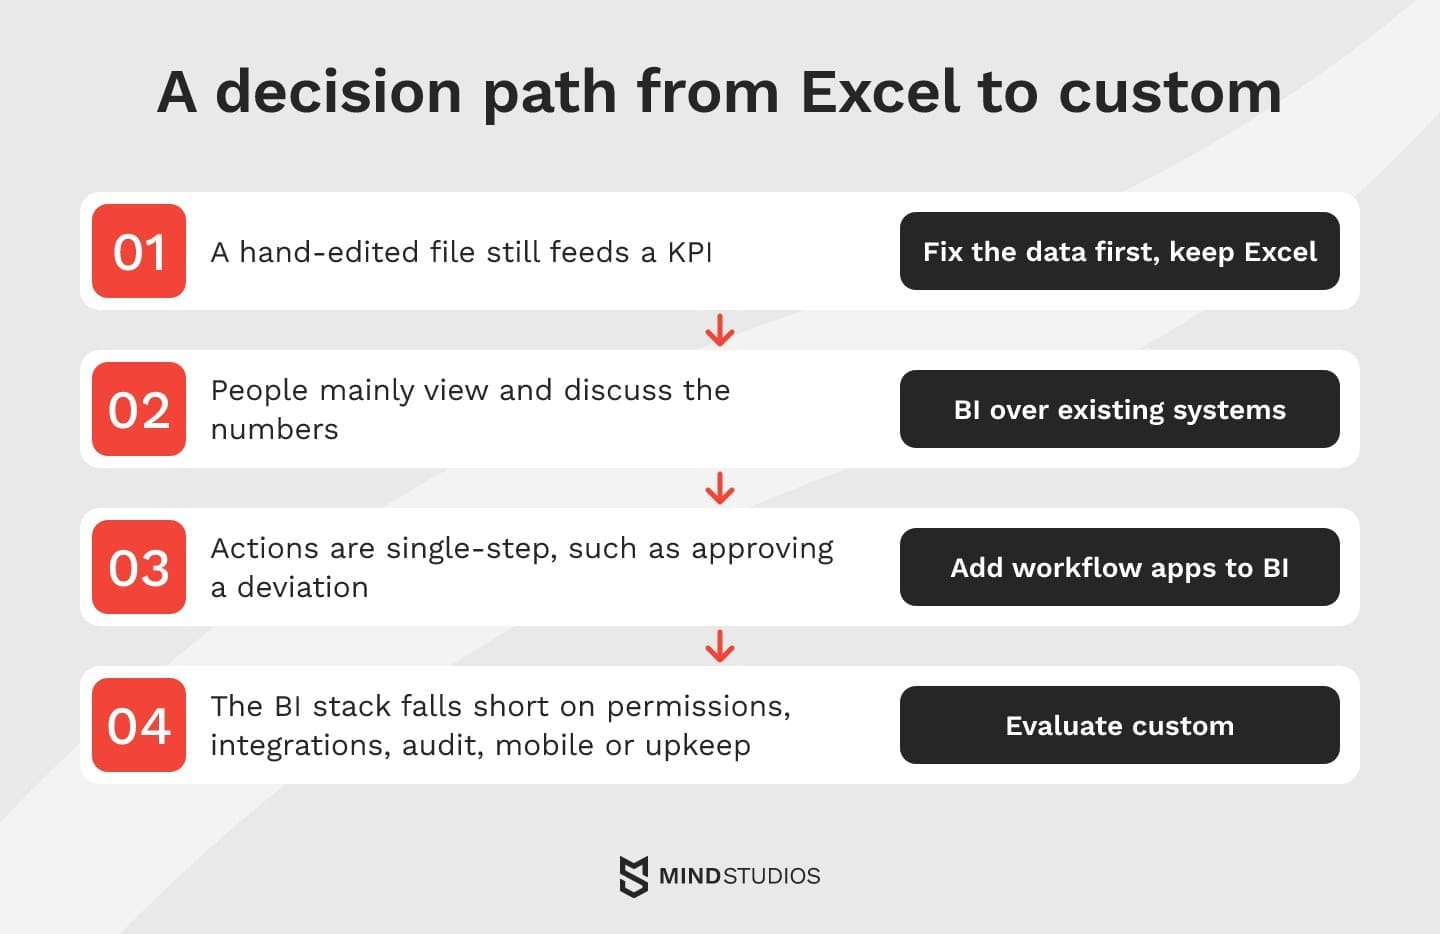
You can enter this path at any step:
- If a hand-edited file still feeds a KPI, fix the data first and keep Excel in the meantime.
- If people mainly view and discuss numbers from reliable systems, BI over existing systems is enough.
- If actions are single-step, such as approving a deviation or creating a task, add workflow apps to the BI layer.
- If the BI stack falls short on permissions, integrations, audit, mobile use or upkeep, evaluate custom.
At step four, the dashboard becomes part of a custom software build, next to dispatch and pay modules or a custom CRM for customer-facing teams.
Dmytro Dobrytskyi, CEO at Mind Studios, describes the test he runs with founders before recommending BI or a custom build:
Before we talk tools, we walk one real deviation end to end: who sees it, who approves it and where that approval lands. On Medienlogistik, an approved detour fed into courier pay, so we built the screen into the system that calculates pay. If the path ends with a conversation in a weekly meeting, a BI tool on clean data will usually serve you well.
If you can't tell which step your operation has reached, it's worth checking whether BI will still carry it or a custom build is due.
How to build a logistics KPI dashboard teams actually use
Start with the decisions the dashboard should support, then work backward to KPIs, data and screens. Teams use a dashboard when every number on it has an owner, a definition they trust and an action attached. Easy charts alone give no reason to return.
Seven steps from decisions to go-live
Each step depends on the last:
- List decisions by role: what each person decides daily, weekly and monthly.
- Audit the data: which system holds each input, how complete it is and who owns it.
- Write KPI definitions: formula, exclusions, owner and a baseline target.
- Prototype screens by role: use real sample data and test them with the people who will use them.
- Set alerts for exceptions only: each with a threshold and a named recipient.
- Build integrations and validation checks: bad records get flagged before they reach a KPI.
- Accept on live data: assign KPI owners and set the review rhythm (daily for operations, weekly for managers, monthly for leadership).
Mind Studios' recommendation: Build the screen from independent widgets (KPI tiles, an exceptions list, a route map, a delay heat map) on one data layer, so a new role or metric means adding a module.
Accepting the dashboard on one real shipment
Before rollout, trace one recent problem load end to end and confirm that:
- TMS events match proof of delivery and telematics
- the KPI counts the load in the right period
- the exception fired at the agreed threshold and reached the owner's device
- the action taken shows on the screen
Fix any break in that chain before launch, or users will find it in their first week.
Mistakes that make teams stop opening the dashboard
During the pilot, these pairs show which metrics users can see but can't act on:
- Do pick KPIs from decisions. Don't track a metric because a template shows it.
- Do show exceptions and the shipments behind them. Don't rely on averages that hide one failing lane.
- Do give each KPI a named owner. Don't publish metrics nobody is accountable for.
- Do agree on the response when a KPI slips. Don't hold reviews that end without an action.
Pay-linked KPIs raise the stakes for these checks, as our delivery fleet project shows.
What we learned building role-based dashboards for a delivery fleet
At OÖ Medienlogistik, an Austrian print media delivery company we've worked with since October 2019, the dashboards sit inside the system that verifies courier mileage and calculates pay.
The problem
There was no reliable way to calculate the real distance couriers drove from the terminal to delivery points. Mileage was worked out by hand, pay was disputed, payroll ran late and managers had little visibility into daily operations.
What we built
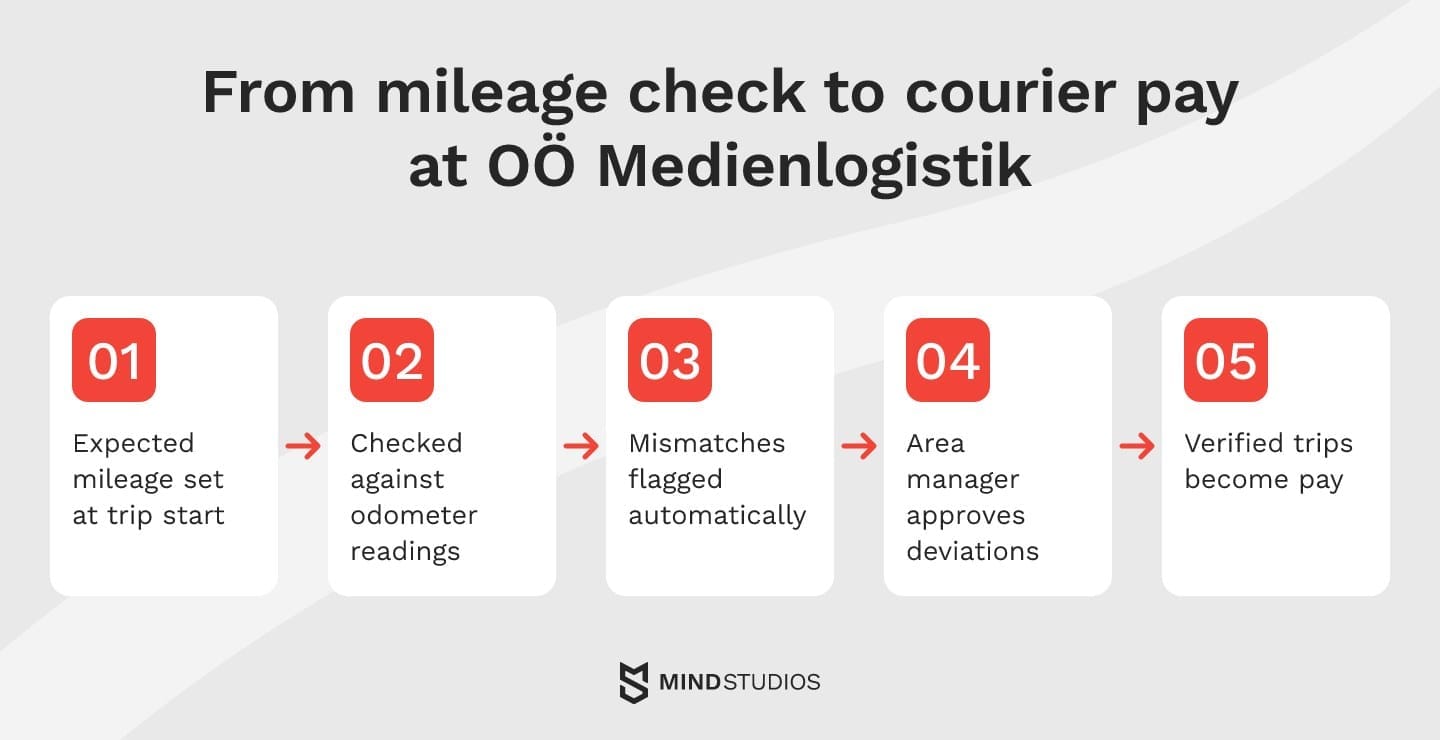
The platform covers each step:
- Mileage check: Google Maps Distance API calculates the expected route distance at trip start, odometer readings verify the actual mileage and mismatches are flagged automatically.
- Detour alerts: real-time alerts report detours, and area managers approve deviations.
- Pay: the HR and finance module turns verified trips into pay.
- Role-based dashboards: couriers, area managers and administrators each get their own, and admins also see trip and efficiency reports.
Results
In the first month, 100% of couriers adopted the system. Payroll processing time dropped significantly, the platform replaced several third-party SaaS subscriptions and route planning lowered fuel costs.
What it means for your logistics KPIs
For your own logistics KPIs, map each number to its chain the same way before building. A figure that can't be traced to the record, check and approval behind it leaves disputes as open as they were in the spreadsheet.
Mind Studios' recommendation: We moved our own planning, HR and asset tracking from spreadsheets into Dashboard, our internal ERP. If you compare plan with actuals, keep the expected and verified figures in one system, because two systems give them two chances to drift apart.
Start with the decisions, then design your logistics KPI dashboard
The Monday spreadsheet from the start of this guide is a symptom of decisions made on late data. To find your path, list five decisions your team made last week and check which system each number came from and how late it arrived.
The gaps in that list tell you whether to fix definitions, add a BI layer or build the dashboard into your operations.
If you'd like a second pair of eyes on it, the next step is mapping which decisions your dashboard should support and which data is still missing.
FAQ
What is a logistics dashboard?
It's a shared screen that turns transport, warehouse and finance data into the few numbers each team checks daily. The test: a dispatcher, fleet manager or CFO opens it and knows within a minute what needs attention.
What are the KPIs for logistics?
Start with one logistics KPI per decision area and add more only when a gap shows up:
- Service: OTIF, since customers judge you on it
- Cost: cost per shipment, split by component
- Your constraint: tender acceptance for a 3PL, utilization for a private fleet, dock-to-stock for a warehouse operator
- Later: claims and emissions, when contracts ask for them
What should a logistics KPI dashboard include?
A screen is ready for rollout when any exception on it traces in a few clicks to:
- its source record in the TMS, WMS or ERP
- the KPI definition and threshold behind it
- a named owner and the expected action
- the time the data last loaded
What should a fleet management dashboard include?
Sort it by the vehicles that need action, most costly first:
- vehicles off route or idling right now
- vehicles past their maintenance due date
- the worst fuel-per-mile results this week
- planned vs. actual mileage gaps by driver
Keep fleet averages in a weekly tab, because they hide the trucks that cost the most.
How often should a logistics dashboard refresh its data?
Two limits decide it: how fast someone can act and how often the source updates. Telematics can stream positions, but a carrier that sends EDI status twice a day caps how fresh that lane can be. Set each widget to the slower of the two and show its timestamp.
Should you build a logistics analytics dashboard in Power BI or as custom software?
A prototype answers this better than a feature list. Load a week of real data into Power BI, check the KPIs against finance's figures, walk one deviation from alert to approval and add a field user on a phone. If it passes, with licenses priced for every role joining within a year, start there.
How is data analytics in logistics different from a dashboard?
Data analytics in logistics looks for causes and forecasts, such as why transit times rose on one corridor or what volume next quarter brings. A dashboard monitors agreed KPIs and flags deviations.
How many KPIs should one dashboard show?
A shift lead may need three numbers; leadership can scan more because it reads trends. Review the set quarterly and move quiet KPIs to a drill-down, except those tied to contracts or rare, costly risks such as claims.
Can you build a logistics dashboard without a TMS?
Yes, as long as shipment data has a home. Some networks start with ERP orders, telematics and carrier portals joined in one database. Expect more data cleaning and manual input, and plan for a TMS or a custom dispatch module once volume outgrows that setup.