
 ChatGPT
 Perplexity

An AI ROI figure is only as reliable as the baseline and full cost behind it. Here's how to test a promised payback, or build your own, before the budget moves.
Highlights
- Savings, payback and ROI answer different board questions and need separate formulas.
- Typical AI use cases take years to reach satisfactory returns, so one-year promises need evidence.
- A real-data pilot with one financial threshold and set quality limits decides scaling.
AI ROI is the return an AI system delivers over a period, measured against everything it costs to build and run. You can estimate it before you fund a project if you keep three numbers apart, start from a measured baseline and count running costs alongside the build.
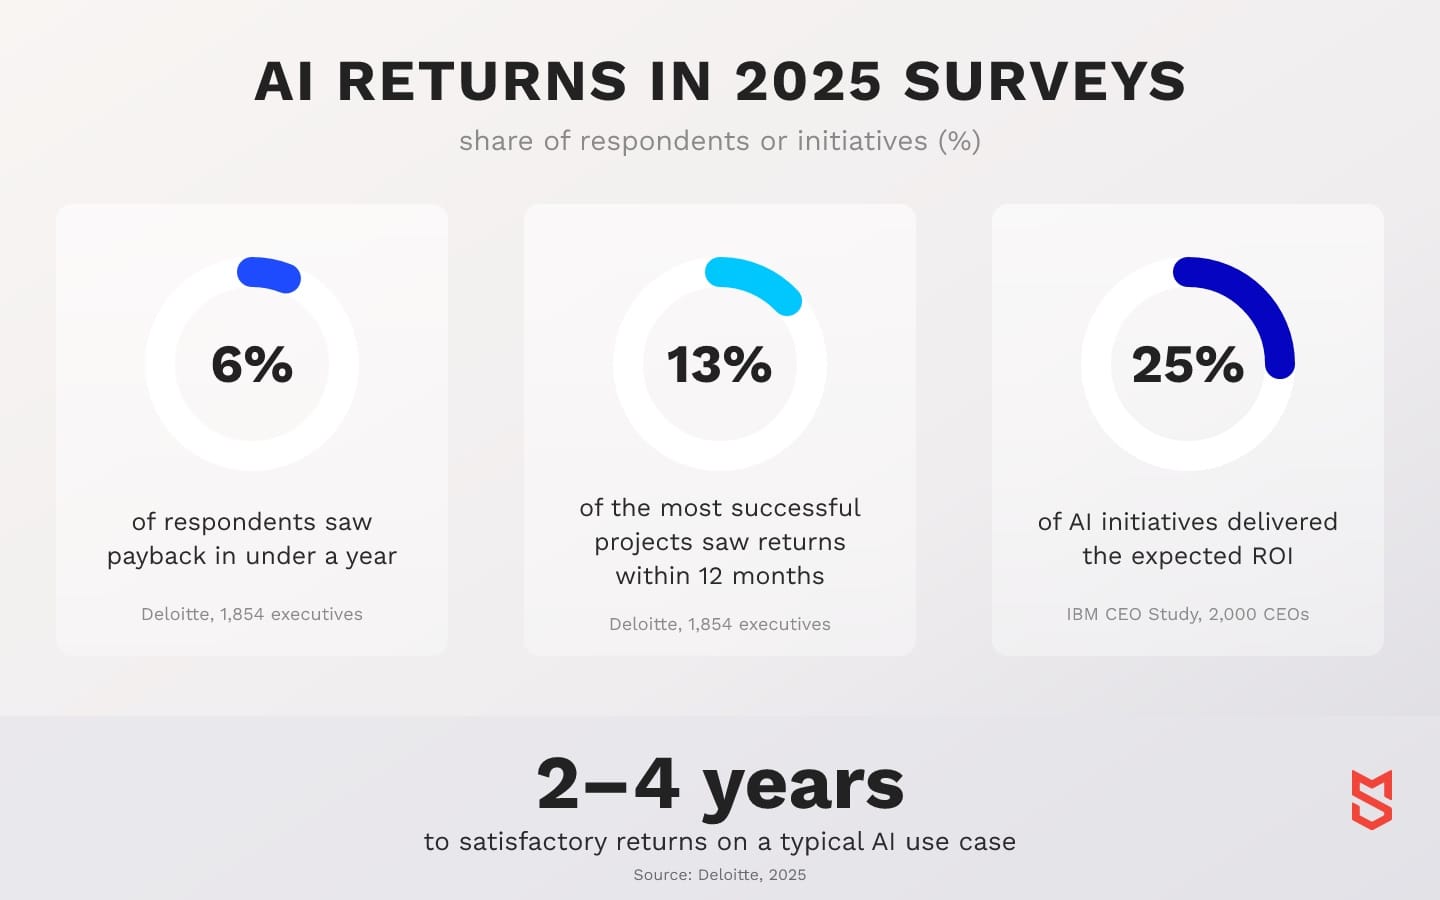
The first thing to adjust is the timeline. In Deloitte's 2025 survey of 1,854 executives in Europe and the Middle East, most respondents reported satisfactory returns on a typical AI use case within two to four years, against the seven to 12 months organizations expect from technology investments. Only 6% saw payback in under a year.
We built the computer vision system on TIKPACK's packaging line, and it paid for itself in under 12 months. This guide shows what to ask for, how to calculate payback on your own numbers and how to check it after launch.
If a team or vendor has already handed you a payback figure, check the baseline behind it before the budget is approved.
What AI ROI measures: savings, payback and ROI
The phrase covers three different numbers, and each one answers a different board question. Annual savings show how much a process improved against its baseline. Payback shows how many months net benefit takes to cover the build cost. ROI over a period compares total benefit with total cost across a stated horizon.
These are the working definitions we use at Mind Studios and adapt to each client's process:
| Metric | Formula | Board question |
|---|---|---|
| Annual savings (gross benefit) | Baseline annual process cost − process cost with AI, before the system's running costs | How much better does the process perform each year? |
| Payback period | Build cost / net monthly benefit | How many months until the build cost comes back? |
| ROI over a period | (Benefit over the period − full cost over the period) / full cost over the period × 100% | Was the whole investment worth it over this horizon? |
Two definitions keep the formulas consistent. Gross benefit is counted before the system's own running costs, and for extra revenue you count the added margin. Net benefit = gross benefit − running costs, and payback is counted from go-live.
The three numbers can point in different directions. A system can save a lot every year and still show negative ROI in year one, because the build cost arrives upfront while the benefit builds up month by month.
ROI also needs a stated horizon. Without one, the board can't compare the estimate with anything else it funds.
Hard and soft benefits
Hard benefits show up on a line of the P&L (fewer defects, less rework, lower handling cost or added margin), and they go straight into the formulas. Soft benefits, such as faster customer answers or lower compliance risk, are real. They become money only through a method agreed before the project starts.
Hours saved are the most common trap. They count as money only when they turn into lower spend, a hire you can put off or extra output the business can sell. Otherwise they're freed capacity: report it next to the ROI figure and keep it out of the calculation.
Why AI returns are hard to prove
AI returns are harder to prove for four reasons. The benefit spreads across a whole process. AI usually ships together with other changes. Pilots often run on cleaner data than production does. And keeping accuracy up in production costs more than reaching it in a demo.
Two large 2025 surveys look at different sides of the problem. Deloitte tracks when returns arrive: even among the most successful AI projects, only 13% saw returns within 12 months.
IBM tracks whether results match expectations. Its 2025 CEO Study of 2,000 CEOs in 33 countries found that 25% of AI initiatives delivered the expected ROI over the last few years, and only 16% scaled enterprise-wide.
Deloitte's authors trace weak enterprise AI ROI to structural causes. Intangible benefits such as better vendor relationships are hard to value, and siloed systems complicate before-and-after comparisons.
Accuracy adds cost late, too. A model that performs well in a demo may need more work to stay accurate at production speed, on messy inputs and with a safe fallback when it's unsure. That work belongs in the estimate.
So treat a payback promise inside a year as an exception that needs evidence, and ask what makes this project different from the typical case.

The inputs an AI ROI estimate needs
Knowing how to measure AI ROI starts with six inputs: the process baseline, the value of one unit of improvement, the build cost, the running cost, the adoption rate and the horizon. With all six, the formulas take minutes. Without a baseline, no formula produces a figure you can defend in front of a board.
The table shows where each input usually comes from and the mistake that most often distorts it.
| Input | Example and source | Common mistake |
|---|---|---|
| Process baseline | Defect rate, cost per document or handling time, from operational records | Using one good week or a vendor's industry benchmark |
| Value of one unit of improvement | Cost per customer-reaching defect, agreed with finance | Counting the full salary of anyone whose task gets faster |
| Build cost | Discovery, data collection and labeling, development, integration, hardware | Pricing the model and forgetting integration and data work |
| Running cost | Infrastructure or inference, monitoring, retraining, human review of low-confidence cases | Leaving it out, which shortens payback on paper |
| Adoption rate | Share of volume that actually goes through the system, month by month | Assuming 100% from the first month |
| Horizon | One year and three years, matched to the expected life of the system | Comparing one-year AI returns with multi-year returns from other projects |
In the value row, a defect's cost covers rework, waste and complaint handling.
Why the baseline comes first
Every other input is measured against the baseline, which should come from at least three months of operational records (longer if demand is seasonal). On the TIKPACK line, the defect rate before the system was about 1.0%. That gave the business case a starting point in the same unit as the result the business pays for. Precision and recall stay as engineering checks.
Running costs the CTO will ask about
Running costs are where CTOs usually push back, and rightly. The operating budget should include the monitoring, retraining and human review the chosen system requires. How often each is needed, and what it costs, depends on the workflow and deployment.
Our guide to software development costs covers the ownership costs to include alongside the AI-specific budget.
How to estimate AI ROI before you fund the project
An AI business case takes six steps before funding, from choosing one process to setting the decision rules. The arithmetic is simple. The discipline is agreeing, before any money moves, on what result would justify scaling. A pilot on real data then replaces the assumptions with facts.
The six steps, in order:
- Choose one process and metric. Pick the process with the highest volume multiplied by cost of error, and name the single metric to move.
- Measure the baseline. Pull at least three months of operational records, longer if demand is seasonal.
- Set a benefit range. Estimate a conservative and an expected improvement, and turn each into gross annual benefit using the value of one unit.
- Add up full costs. Use the inputs above: the build cost plus running costs for every year of the horizon.
- Calculate payback and ROI. Run both scenarios for year one and year three so the board sees the spread.
- Set the thresholds. Fix one financial threshold and the quality limits: agree what payback the business requires, which operational limits the system must hold and who makes the call.
Payback and ROI formulas with a worked example
Any AI ROI calculator rests on arithmetic like the simple, undiscounted model below. Comparing its assumptions with a vendor's tool explains why their results differ. Four inputs are enough:
- I > 0: build cost
- B ≥ 0: gross annual benefit, before the system's running costs
- O ≥ 0: annual running cost
- H > 0: horizon in years
Net annual benefit is N = B − O. Payback in months, counted from go-live, is 12 × I / N. It exists only when N is above zero: if running costs eat the whole benefit, the system never pays back.
ROI over the horizon is (B × H − I − O × H) / (I + O × H) × 100%. A benefit figure that already has running costs deducted is N. Recover B = N + O before you use this formula, so running costs are counted only once.
These formulas assume a steady benefit from go-live, with no discounting, taxes or residual value. If adoption ramps up, list benefit and running cost month by month instead. Payback is then the month when cumulative net benefit first reaches I, and ROI uses the totals for those months.
Two scenarios against a payback target
The made-up figures below assume a steady benefit and show how two scenarios pull apart. They say nothing about real project costs.
| Input or result | Conservative case | Expected case |
|---|---|---|
| Build cost (I) | $120,000 | $120,000 |
| Gross annual benefit (B) | $60,000 | $90,000 |
| Annual running cost (O) | $18,000 | $18,000 |
| Net annual benefit (N) | $42,000 | $72,000 |
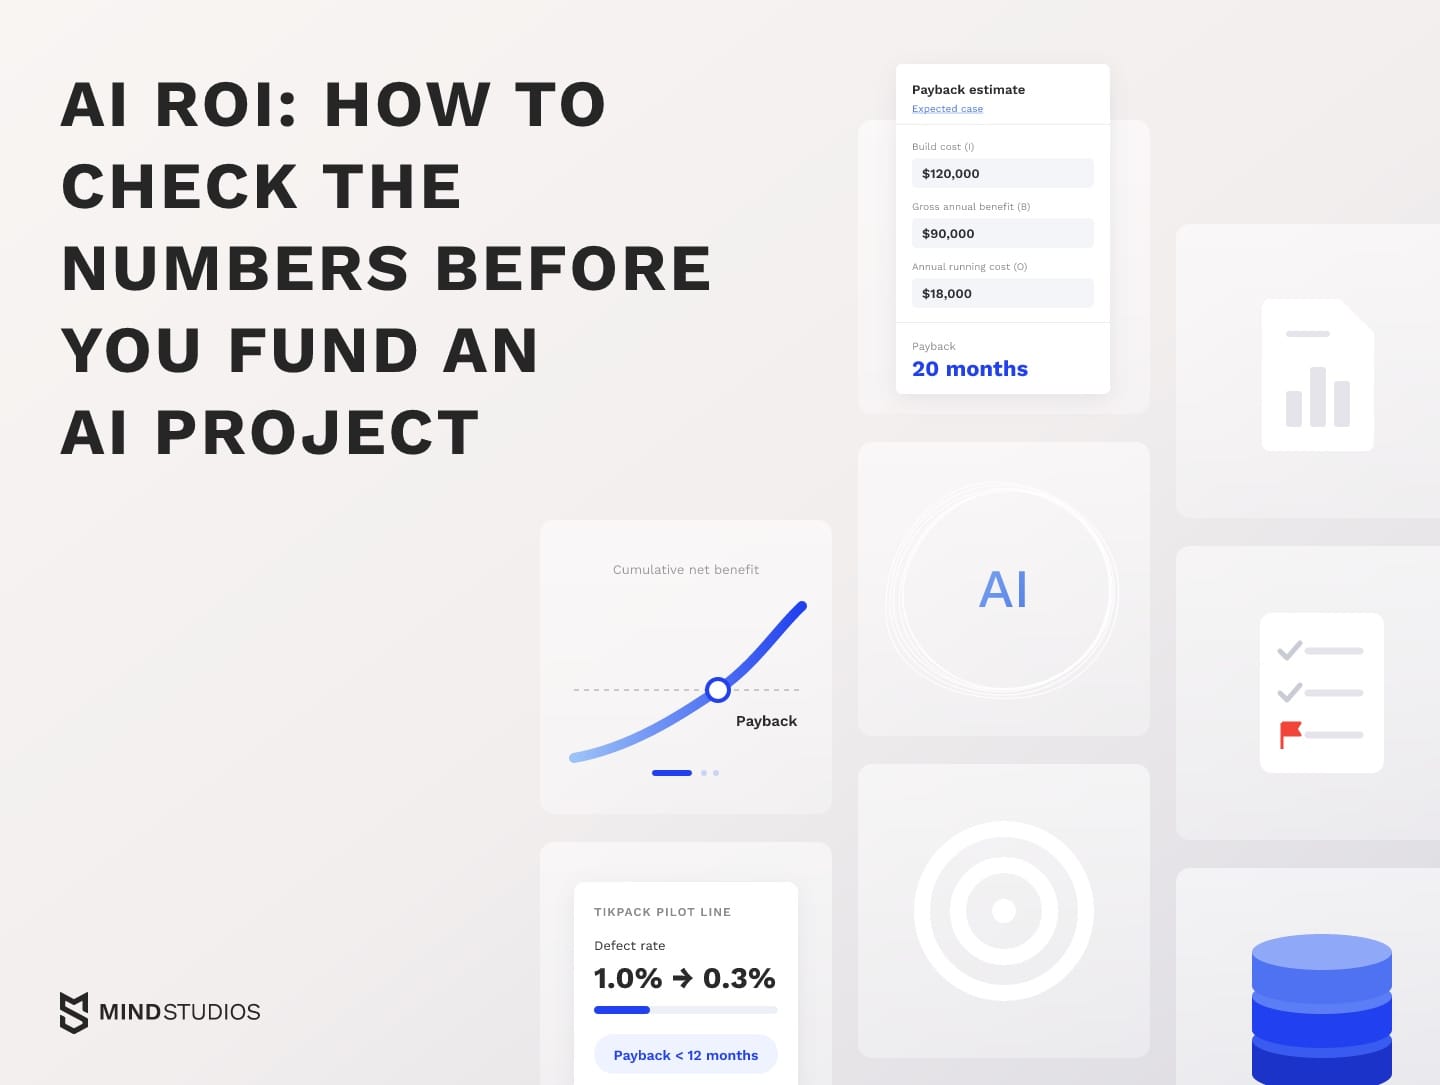
| Payback | 34 months | 20 months |
| ROI, year one | −57% | −35% |
| ROI, three years | 3% | 55% |
Both cases lose money in year one, and only the expected case returns well by year three.
Suppose the board requires payback within 36 months. With a $120,000 build, that means net annual benefit of at least $40,000. The conservative case clears it narrowly and the expected case clears it comfortably.
A pilot with preset scale or stop thresholds
A pilot replaces assumptions only if it runs on real production inputs and its thresholds are written down before it starts. Scale the pilot's measured net benefit per unit to expected volume and adoption, with running costs at the same scale, and compare it with the financial threshold. Check the quality limits separately.
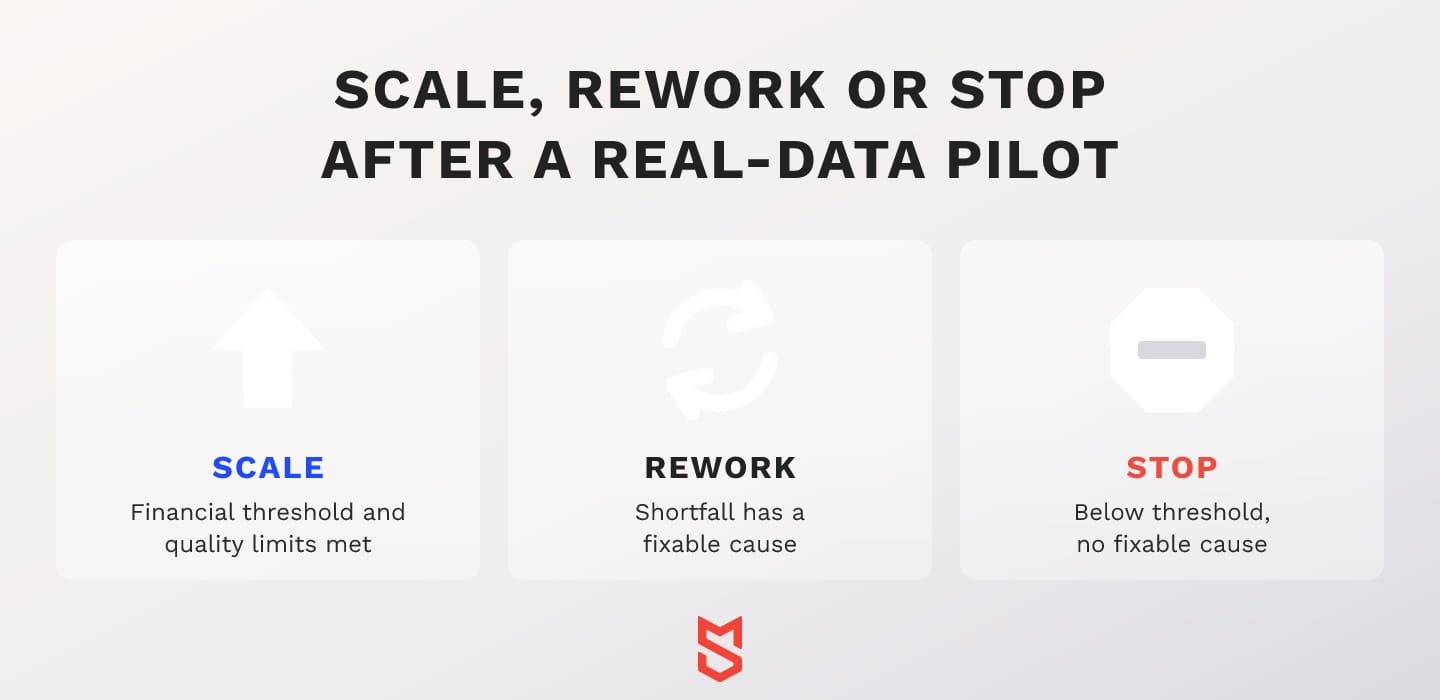
The comparison leads to one of three outcomes:
- Scale if measured net benefit meets the threshold and every quality limit holds.
- Rework if the shortfall has a fixable cause, such as slow adoption or one missed quality limit, with a set budget and date for the recheck.
- Stop if net benefit stays below the threshold, or a required quality limit can't be met, and there's no fixable cause.
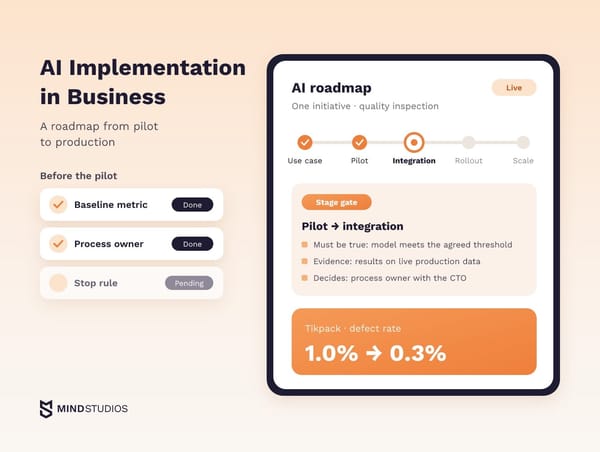
Our AI integration roadmap covers how to take a pilot through to daily operations.
Measuring AI ROI after launch
AI ROI measurement after launch compares actual results with the baseline from the business case, using the same data source. The hard part is attribution: separating what the AI changed from what seasonality, pricing or a new process changed. A comparison group helps when both groups face similar demand and operating conditions.
Attribution matters because perception drifts. In a 2025 METR study, experienced developers expected AI tools to speed them up by 24%. Afterward they believed they'd been 20% faster, yet their measured completion times were 19% longer.
METR's 2026 follow-up suggests AI tools probably speed developers up more now, though it calls its new measurements weak evidence of how much. The lesson for a business case is about method: what a team feels and what the records show can diverge, so rely on the records.
Here's the KPI set we start from and adapt to each process, with the cleanest way to isolate the AI's contribution.
| System type | KPIs | Attribution method |
|---|---|---|
| Document and request processing | Cost per document, handling time, error rate; employee satisfaction | Route a random share of volume through the old process |
| Forecasting and predictive models | Forecast error, stockouts, write-offs; planner confidence | Compare against the previous forecasting method over the same periods |
| Computer vision | Defect rate reaching customers, false rejects, throughput; audit readiness | Phased rollout line by line, with untouched lines as the control |
| Generative assistants | Time per task, resolution rate, output volume; quality ratings | A/B test by team or user group, with tasks matched by type |
Track actual results against the forecast every month for adoption, net benefit per unit and running cost. Recalculate the forecast when adoption lags, running costs leave the planned range or input data shifts enough to affect accuracy.
Mind Studios' recommendation: Write down the baseline query before the pilot and run the same query after it, on the same data source. Finance can then check the result without relying on the model's logs, and the comparison still holds if the team changes.
Savings and payback from computer vision on TIKPACK's packaging line
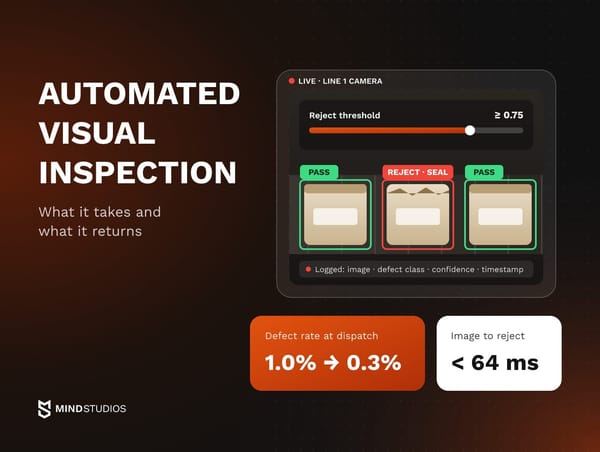
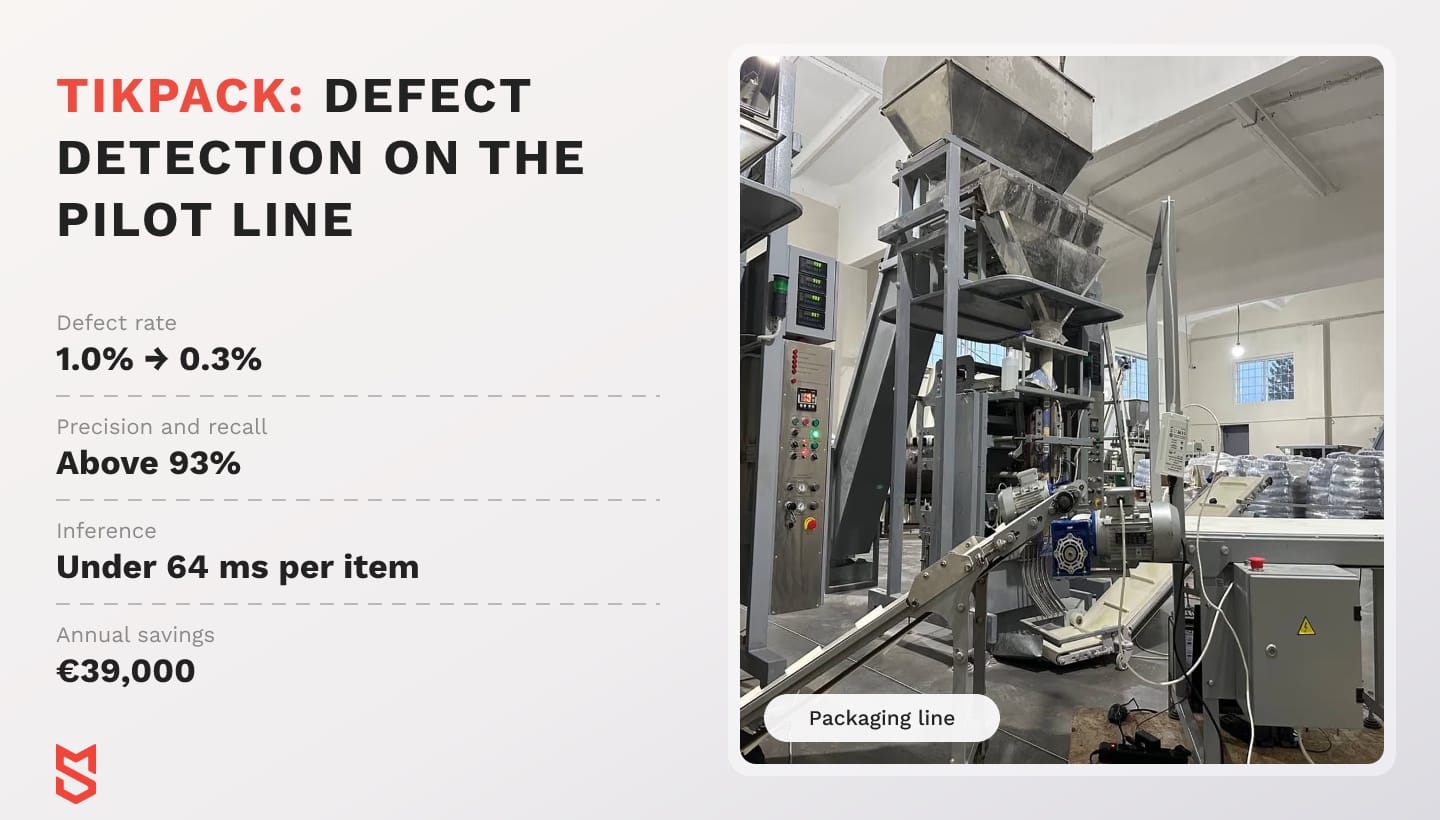
TIKPACK, a grain producer and packager, needed to stop defective packages reaching dispatch without adding inspectors. In 2025 we built an on-premise computer vision system that paid for itself in under 12 months on the pilot line. It inspects every package at full line speed.
The problem: defects reaching dispatch
The line runs at 50 packages per minute, more than 22,000 per shift. About 1.0% of packages were defective, from seal failures, film misalignment and incorrect cutting. Manual inspection couldn't reliably keep up at that speed, its accuracy dropped as operators got tired and it left no image evidence for audits.
The build and the grant
Two workstreams ran in parallel. Together with TIKPACK's team, we prepared the application for a government grant program, which was approved, and we built AIPack, a defect detection system that runs fully on-premise.
One model locates each package and a second classifies the defect type. Both were trained on 3,500+ images from the production line. With no cloud dependency, each item takes under 64 ms, and every decision is logged with its image.
The results
Results on the pilot line:
- Defect rate down from about 1.0% to 0.3%, a 70% reduction
- Precision and recall above 93%
- False rejects under 0.6% of good product
- €39,000 in annual savings on the pilot line
The defect rate links the line to the financial case, while savings and payback show how big the benefit is and how quickly it covers the investment.
One process, one metric and a measured result is how we approach custom AI solutions.
Dmytro Dobrytskyi, CEO at Mind Studios, explains why a pilot needs quality limits alongside the financial threshold:
Founders usually set one threshold for a pilot, and it's financial. On a production line that isn't enough, because a model that catches more defects but rejects good product or slows the line just moves the cost somewhere else. Agree on the quality limits next to the payback target, and treat a miss on any of them as a reason not to scale yet.
If you run a process with a measurable error rate, it's worth working through with us whether AI can pay back on it before anyone chooses a model.
What moves AI ROI up or down
Every lever that matters changes one side of the formula: the benefit on top or the full cost underneath. Process choice, data readiness, deployment model, adoption, technical debt and external funding explain most of the gap between a system that pays back early and one that never does.
Process choice, the baseline and adoption are covered above. The three levers below change the formula in ways a first estimate often misses.
Deployment, data and technical debt
Deployment shifts the cost side more than most founders expect. A cloud model priced by usage is cheap at low volume, and its cost grows with every request. Owned hardware costs more upfront, so spread purchase and running costs across the expected workload: low utilization can make the cost per item higher than planned.
Data rules matter too, because an on-premise model keeps production images and customer data inside your perimeter. When an AI system touches production data, ask how the team building it manages information security. Mind Studios, for example, is ISO 27001 certified for information security management and ISO 9001 certified for quality management.
Technical debt belongs on the cost side from the start. In IBM IBV research, enterprises that fully account for technical debt in their AI business cases project 29% higher ROI than those that don't. Executives there expect technical debt to account for 18% to 29% of total AI implementation costs through 2027.
If the AI has to connect to a brittle legacy system, the cleanup is part of the build cost.
External funding
External funding lowers your own investment but leaves the system's economics unchanged. For TIKPACK, the approved grant funded the AI work.
Our enterprise AI playbook covers the readiness side: data, ownership and adoption.
Mind Studios' insight: On TIKPACK's line, 50 packages a minute meant each inspection had to finish before the next package arrived. That is why the system runs on-premise with no cloud round trip. Fix the throughput constraint before you choose a model or a deployment.
Generative AI ROI vs. predictive and computer vision systems
Generative assistants mostly save employee time, which becomes money only when it changes a cost line or output. Predictive and computer vision systems usually reduce an error that already carries a cost, such as a write-off or a defect. The difference lies in the steps between the system's output and money, and the data each step needs.
The table follows that path for three common types of system.
| System output | Path to money | Data needed |
|---|---|---|
| Generative assistant: shorter task time | Time saved → lower cost or added margin | Before-and-after task timing; affected cost line or output |
| Forecasting model: lower forecast error | Better forecast → fewer stockouts and write-offs → recovered margin | Forecast error history, stockout and write-off records, margin per unit |
| Computer vision: defects caught | Fewer defects reaching customers → less rework, fewer returns and complaints | Defect rate at dispatch, cost per defect agreed with finance |
For a generative assistant, the middle step branches: fewer hires or less overtime lowers cost, while more output sold adds margin.
Deloitte's survey adds timing context for the two newest categories. Among respondents using generative AI, 15% already see significant, measurable ROI and 38% expect it within a year of investing. For agentic AI, only 10% see it today, and most expect returns within one to five years.
The survey doesn't compare these categories with predictive or vision systems, so read it as a timeline for generative and agentic projects only.
Agents acting across several systems add another layer, which our guide to agentic AI operations covers.
Red flags in an AI ROI estimate
An estimate needs a closer look before you sign if it skips the baseline, borrows its benefit from someone else's case or leaves out running costs. Each of the seven signs below gives you a specific question for whoever prepared the figure.
- No measured baseline: no baseline, or one taken from a survey instead of records
- Borrowed benefit: benefit copied from a vendor's case study at another company
- No running costs: inference, monitoring, retraining, human review
- Instant adoption: 100% adoption from the first month
- Test-data pilot: pilot results from test data instead of production inputs
- Monetized soft benefits: soft benefits turned into money with no stated method
- Convenient horizon: a horizon that seems chosen to produce the desired answer
When the board asks where the company stands on AI, an answer that holds up is one process, a measured baseline, two scenarios and a payback date the pilot can confirm or rule out. An estimate that clears this list justifies a pilot budget. Funding for full rollout depends on the pilot meeting the agreed threshold and quality limits.
If the estimate on your desk leaves a material assumption unresolved, review its inputs and define what the pilot needs to prove before you commit funding.
FAQ
What is the ROI of AI?
It's the net return an AI system delivers over a stated horizon relative to its full cost: (benefit − full cost) / full cost × 100%. ROI covers only that horizon. Benefits and running costs carry on afterward, so a three-year figure can understate a system that keeps working well beyond year three.
Is AI ROI real?
Yes, though it usually arrives later than boards expect. It's most credible when someone outside the project team, usually finance, confirms the unit value before launch and signs off on the measured benefit afterward.
How do you calculate ROI for AI projects?
Measure the baseline, value the improvement, add build and running costs for the horizon, then apply the ROI formula. Then test how sensitive it is:
- Recalculate with lower adoption than planned
- Recalculate with higher running costs
- Recalculate with a later go-live, which pushes back the payback date and cuts benefit within a fixed horizon
- If payback crosses your threshold in any of these, that input needs pilot evidence
What metrics should I use to calculate AI ROI?
Use metrics that already have a cost attached, each with a clear owner:
- Outcome metric, such as defect rate or cost per document: operations
- Value of one unit of improvement: finance
- Adoption, the share of volume running through the system: process owner
- Running cost per unit and model quality: engineering
- Build cost and the horizon: the budget owner
How do you measure the ROI of AI in operations?
Pick a comparison group that matches the AI group on volume, product mix and shift pattern, such as a similar untouched line. Log any other process change in either group during the period, then convert the difference into money using the agreed unit value.
How long does an AI project take to pay back?
In Deloitte's 2025 survey, most respondents reached satisfactory returns on a typical use case within two to four years. Your own payback comes from your project's cash flow. TIKPACK's computer vision system, with high volume and a known cost per error, paid for itself in under 12 months.
What tools can measure the ROI of AI initiatives?
Most teams combine four tools:
- A spreadsheet model with the formulas and both scenarios
- A BI dashboard that tracks actual results against the baseline
- An experimentation setup for A/B tests or control groups
- Model monitoring for accuracy, drift and running cost
Is an AI ROI calculator enough to approve a project?
No. A calculator checks the logic and shows how sensitive payback is to each input, but it can't tell you whether the inputs are true. Approve rollout funding after a measured baseline and a real-data pilot with a preset financial threshold and quality limits.