
 ChatGPT
 Perplexity

Your app engagement dashboard can show a decline and still not tell you what to change. These 12 metrics, their formulas and a signal-to-cause table link each drop to a product check.
Highlights
- Count users as active once they complete the action your app exists for.
- Pick one primary metric and two to four leading ones per product type.
- Treat every drop as a hypothesis to check in funnels and cohorts.
Mobile app user engagement metrics are the numbers that show how often people come back to your app and whether they complete the actions it was built for. Of all mobile app metrics, these help you check whether users adopted the behavior your release was designed to support.
This guide is for teams with a live product and an analytics setup that still doesn't say what to build next. At Mind Studios we keep developing products after launch, so we put the key action and its events into the requirements before a feature is coded.
A release plan starts with agreeing on the one action your engagement numbers should count.
What is mobile app engagement?
Mobile app engagement is how often users repeat the key actions your product exists for within a set period. In a field-service app that action might be closing a job, in a subscription app finishing a session, in a marketplace placing an order.
Platform tools count activity at a lower threshold. Under the GA4 active users definition, an Android user is active after a first_open event or an engagement_time_msec parameter, and an iOS user after first_open or user_engagement. An engaged session also qualifies.
App Store Connect counts devices. In Apple's metric definitions, a session is any use of the app lasting at least two seconds, and Active Devices are devices with at least one session in the period. Both counters confirm the app was opened, while your own definition shows whether it did its job.
A calculation can be reproduced only when the team agrees on which users it includes, so this guide keeps three populations apart:
- Product-active users: completed the key action in the period.
- Platform-active users: opened the app or had a session, as the tool counts it.
- Eligible users: could take a given action in the period, because they reached that screen or hold the right role.
Because the key action changes by category, user engagement metrics for apps only compare well within one category.
Mobile app user engagement metrics at a glance
The 12 mobile app engagement metrics below fall into four groups: activity (how many people use the app), sessions (how they use it), retention (whether they come back) and adoption (whether they reach the actions that matter).
The formulas are the working definitions we use at Mind Studios and adapt to each product, with each population and window named. "Active" means product-active unless the row says otherwise.
| Metric | Formula | What it shows |
|---|---|---|
| Daily active users (DAU) | Unique users who completed the key action on a calendar day | Size of the daily habit |
| Monthly active users (MAU) | Unique users who completed the key action in the calendar month | Reach of the product |
| DAU/MAU (stickiness) | Average DAU across the month ÷ MAU of the same month × 100% | Share of monthly users active on an average day |
| Session length | Total session time ÷ number of sessions, in minutes | Depth of a single visit |
| Session frequency | Sessions in a period ÷ users with at least one session in that period | How often the habit repeats |
| Session interval | Time from the end of one session to the start of the next | How long users stay away |
| Day N retention | Cohort users who complete the return event on day N ÷ cohort size × 100% | Whether value holds over time |
| Churn rate | Users lost in the period ÷ users active at its start × 100% | Pace of loss |
| Activation rate | Cohort users who complete the key action within N days ÷ cohort size × 100% | Whether onboarding delivers first value |
| Feature adoption rate | Eligible users who used the feature ÷ eligible users with a session × 100% | Whether a release found its audience |
| Key actions per user | Key actions in a period ÷ product-active users in that period | Intensity of use |
| Conversion rate | Users completing the target action within N days ÷ eligible cohort × 100% | Link to revenue |
Apply these conditions when calculating the metrics:
- Session interval: average the gaps per user, then take the median across users with two or more sessions.
- Churn rate: a user counts as lost after crossing the inactivity threshold during the period, and the base is users who completed the key action in the 30 days before it.
- Activation rate: the N days run from sign-up.
- Feature adoption rate: both counts cover the same period, and the denominator includes only eligible users with at least one session in it.
- Key actions per user: read it with the share of eligible users who took the action.
- Conversion rate: the cohort is users who reached the point where they could take the target action, and the N days run from that moment.
Active users, DAU/MAU and app stickiness
Daily active users is the count of unique users who completed the key action on a calendar day. In the platform view, it counts users who opened the app or had a session. DAU, WAU and MAU compare well only when every numerator and denominator uses the same definition, source and time zone.
The stickiness formula is average DAU across the month ÷ MAU of the same month × 100%. As an illustration, an app that averages 2,000 daily active users in November and has an MAU of 8,000 for November has a stickiness of 25%. On an average day, a quarter of the month's users are active.
Stickiness shows how often app engagement repeats but says nothing about what users do once they're in, so read it next to key actions per user.
When a weekly ratio fits better
Products used a few times a week, such as a B2B reporting tool or a field app tied to weekly routes, look weak on a daily ratio even when usage is healthy. For them, average WAU ÷ MAU describes the habit more accurately, because a week matches how people use the tool.
Session length, frequency and interval
Together, session length, frequency and interval describe a habit: how long a visit lasts, how often visits happen and how long users stay away in between. Any one of them alone can mislead, because a long session can mean deep use or a user who can't find what they came for.
Session metrics turn app engagement from a headcount into behavior. Read each one against the rhythm the product was designed for:
- Session length. Compare it with the key action. If it rises while conversion falls, test whether users are spending that extra time searching.
- Session frequency. A messaging or dispatch app is built for several sessions a day, while a reporting tool may be built for two a week.
- Session interval. A widening interval within a cohort can show drift before those users drop out of MAU.
Screen flow shows where sessions end. For any screen, exit rate = exits from that screen ÷ views of that screen × 100%, and a high rate on a screen that should lead somewhere, such as sign-up or checkout, is the first place to look.
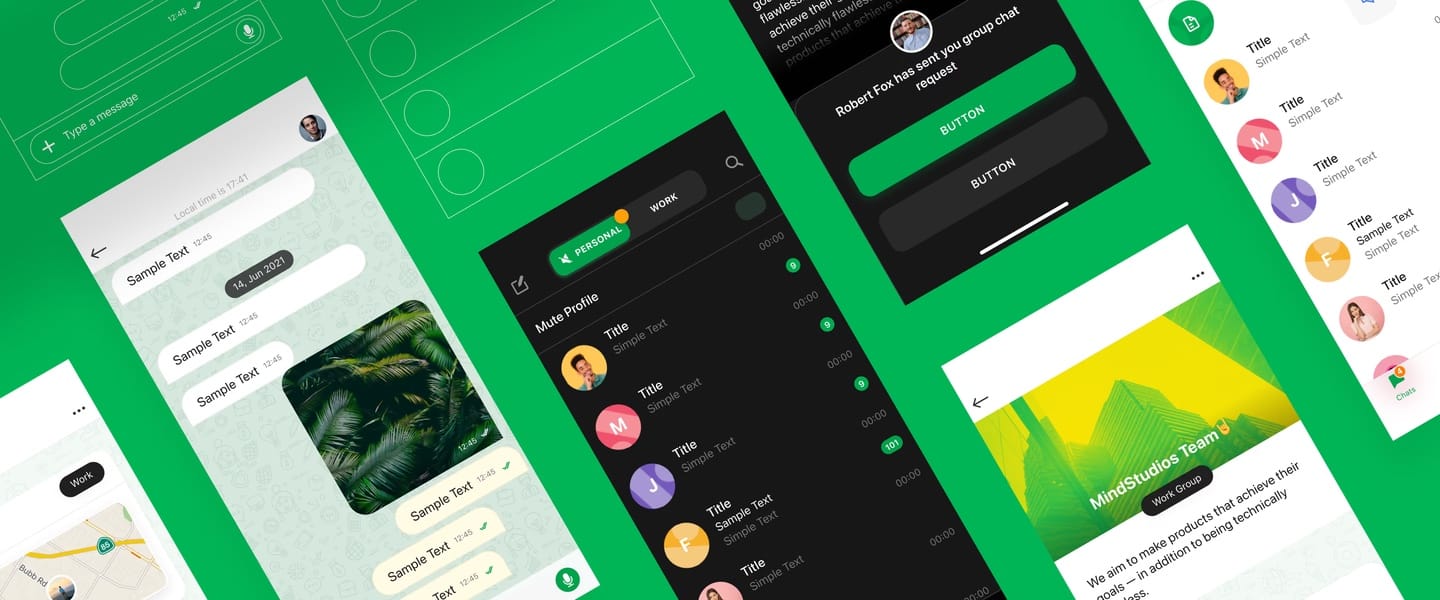
The Chapp messenger we built, a secure app with separate work and personal modes, has an average session length of 20 minutes.
App retention rate and churn: how to calculate both
Here's how to calculate app retention rate. Take a cohort of users who performed a start event on the same day, count how many perform the return event on day N, and divide by the cohort size. Day 1, Day 7 and Day 30 are the common checkpoints, each read only for cohorts whose day N has already passed.
App churn rate looks at the same problem from the other side. The base is users who were active at the start of the period, meaning they completed the key action in the 30 days before it. Count those who cross an inactivity threshold during the period, for example 30 days without the key action, and divide by that base.
Uninstalls are counted separately, because an inactive user may keep the app installed.
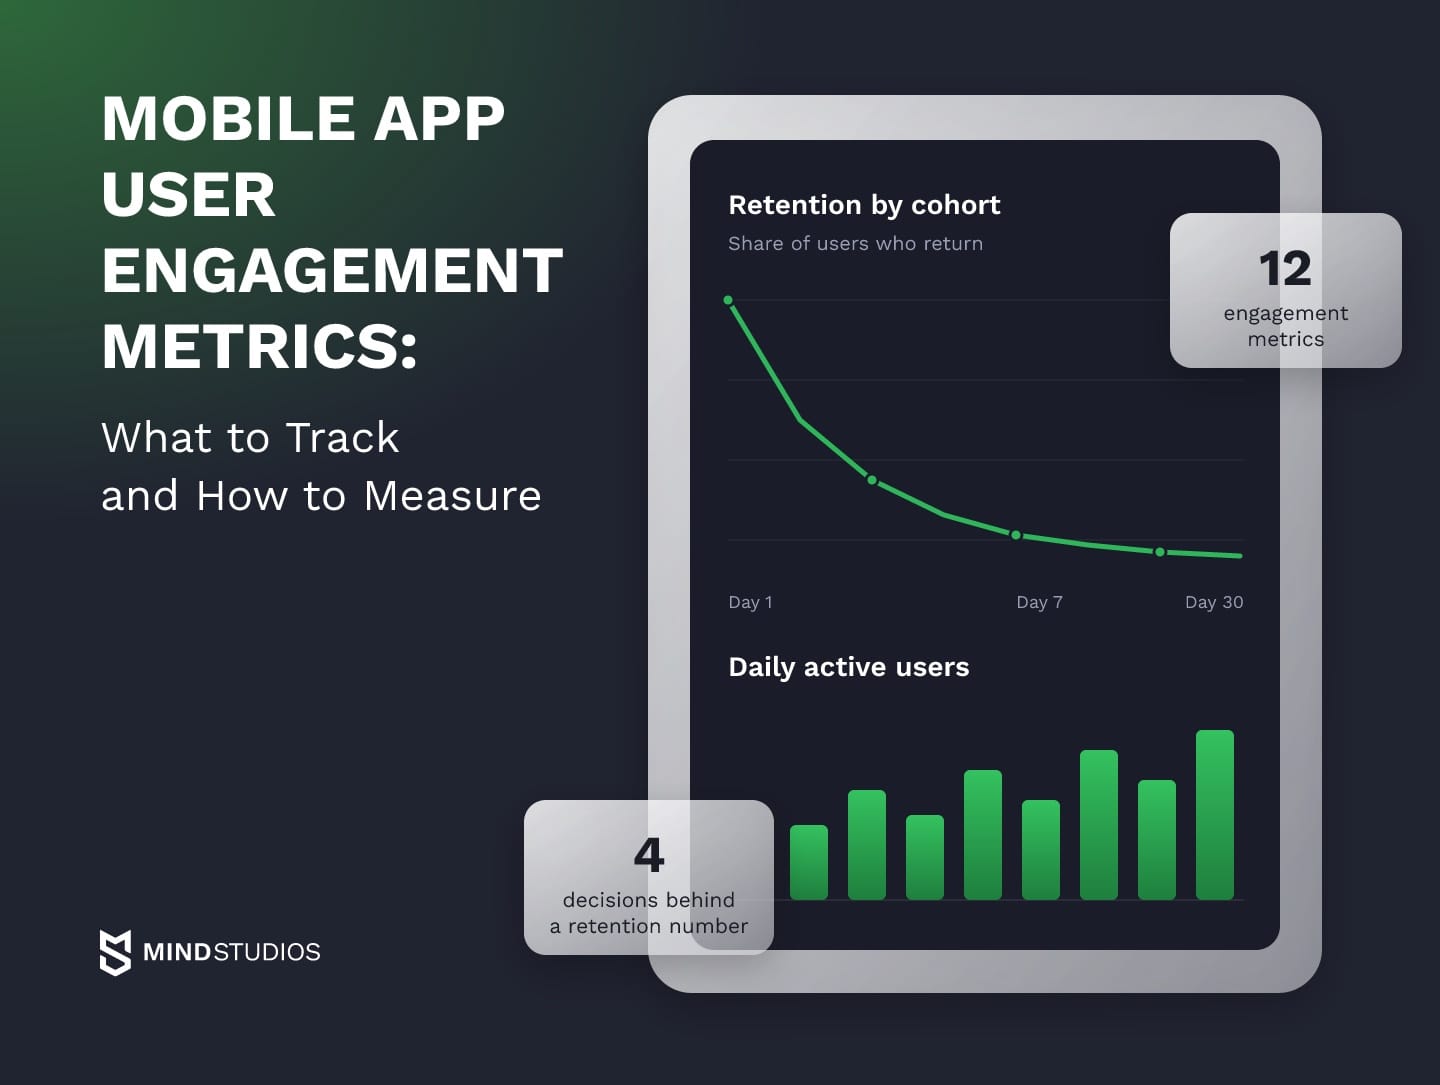
Four decisions behind a reproducible retention number
These four decisions go into the tracking spec and stay fixed across cohorts:
- Pick the start and return events. The start event is usually sign-up or first open. The return event is the key action, so a user who opens the app and leaves isn't counted as retained.
- Fix the cohort denominator. Count everyone who performed the start event on that date, minus test and internal accounts.
- Set the window. Use either a calendar day in one time zone or a rolling 24 hours from the start event. Mixing the two shifts Day 1 for users who sign up late in the evening.
- Choose "on day N" or "on or after day N." In Amplitude's retention calculation, Return On counts users who returned on exactly that day, and Return On or After counts that day or later. Users who haven't reached later intervals are left out of the denominator, so incomplete cohorts can make a curve look as if it's rising.
As an illustration: of 1,000 users who signed up on March 1, 300 completed the key action on day 7, so Day 7 retention is 30%. The same arithmetic works by month. If 300 of 1,000 users who signed up in January complete the key action in February, the January cohort's month 1 retention is 30%.
Treat the shape of the curve as a hypothesis. A steep drop from Day 1 to Day 7 can point to onboarding, and a slide from Day 7 to Day 30 can point to the value users find after their first week. Funnels and cohort splits will confirm or reject either reading.
What is a good retention rate for an app?
A good retention rate depends on how often users need the product, so a daily tool and a monthly planning app set different bars. A market benchmark is comparable only if it states its sample, data period, events and window. Without those details, your own previous cohorts, measured with the same events and window each time, are the more reliable reference.
Envol: a retention figure needs its window
The Envol app is a wellness app. We rebuilt it for Android from scratch and built a new iOS app, starting with an analysis of the previous app and surveys of existing users. The published results are a 43% retention rate and over 8,000 active users.
The 43% figure has no stated window or return event, so it can't be compared directly with Day 1, Day 7 or Day 30 numbers from other apps.
Activation, feature adoption and conversion
Activation, feature adoption and conversion show whether engagement reaches the actions that pay for the product. Activation tracks new users reaching first value, and adoption tracks whether a feature found the users it was built for. Conversion tracks the step to a paid plan or to a target action such as a booking.
Each of the three depends on the right denominator, because the wrong base can make a weak feature look fine:
- Activation rate. Read it only after every user in the cohort has had the full N days. A low rate with healthy installs sends the search to onboarding, permissions or an empty first screen.
- Feature adoption rate. Count only users who could use the feature. A manager-only report, for example, is measured against managers who opened the app in that period.
- Conversion rate. Start the cohort at the screen where the action becomes possible, such as the paywall or checkout, and count completions within a fixed window, such as 7 days.
ARPU (revenue in a period ÷ product-active users in that period) can use other bases, such as all users or paying users, so state which one you use. With LTV (revenue per user over the whole relationship), it connects app engagement to revenue.
Adoption in an internal B2B app: OÖ Medienlogistik
Adoption carries more weight when the users are employees, because staff who skip a workforce app push the work back to spreadsheets and phone calls. For OÖ Medienlogistik, a print media delivery company in Austria, we built a platform for fleet management, dispatching, mileage verification, HR and payroll.
In the first month after launch, 100% of the company's couriers adopted the new system.
Choosing the app engagement metrics that drive product decisions
A workable set has three to five numbers: one primary metric, such as the share of eligible users who complete the key action in the window, and two to four leading metrics that move earlier.
The table matches four common product types with a primary metric, leading indicators and a window. Each primary metric is a share of everyone who could take the action, so its base doesn't depend on the result. Each metric also needs an owner who decides what changes when it falls.
| Product type | Primary metric | Leading metrics | Window |
|---|---|---|---|
| B2B SaaS | Share of provisioned accounts completing the key action | Key actions per active account, activation by role, WAU/MAU | Week |
| Subscription app | Share of current subscribers completing the core action | Day 7 retention, session frequency, trial-to-paid conversion | Week and month |
| Marketplace | Share of eligible buyers who placed an order | First order or listing, repeat order in 30 days, retention on both sides | Month |
| Internal employee app | Share of assigned staff completing the key task | Adoption by team, task completion time, error rate | Day or week |
In the marketplace row, sellers get a separate metric, such as listings published.
The account is often the unit that matters. In a B2B SaaS product, one heavy user can hide a company that has stopped logging in, so retention and adoption are counted per account and per role as well as per seat.
Dmytro Dobrytskyi, CEO at Mind Studios, explains what the Chapp funnel work taught him about choosing release metrics:
The primary metric should reflect the result the company wants after several releases. A single release then needs its own near-term number. With Chapp, funnels pointed to specific stages where users quit, and we changed the screens at those stages. A release metric works at that level: a step you can name and a change you can point to.
How to measure mobile app user engagement: from events to a dashboard
Measuring engagement starts with an event schema written before release: the key action, the events and properties that describe it, and the rules for identifying users. The tool, the dashboard and a review cadence come next, because tracking added after launch misses the first cohorts that a release decision depends on.
Five steps from key action to dashboard
- Name the key action. Write one sentence the team agrees on, such as "a dispatcher assigns a route."
- Define events and properties. Each event gets a name, a trigger (on tap or on server confirmation) and properties such as plan, role, platform and app version. For actions that can fail, a server-confirmed event records what actually happened.
- Identify the user. Decide how an anonymous install merges with a signed-in account, and how one person with a phone and a tablet becomes one user. Without these rules, multi-device users inflate DAU.
- Choose the tool and send the data. Connect the platform consoles and one product analytics tool, and add a raw export to your own storage.
- Build the dashboard and set a cadence. Build one view per decision: daily health, weekly cohorts and release reviews.
Tools and consent
For app engagement analytics, a common setup pairs platform data with one product tool. Google Analytics for Firebase captures events automatically, along with user properties, and accepts custom events. The Google Play Console statistics page reports installs, uninstalls, active users and retention, and App Store Connect covers iOS.
Product analytics tools add per-user paths. Amplitude's funnel analysis shows where users abandon a defined path, and Mixpanel funnels calculate conversion from one event to the next within a time window.
Consent shapes what you can collect. On iOS, App Tracking Transparency requires permission before app data is linked with other companies' data for ads or ad measurement. In the EU, processing personal data needs a lawful basis under GDPR, so the event list and the consent flow are designed together.
A tracking spec card for one metric
Here's a spec card for one metric in a route-assignment app:
- Metric: daily dispatcher activity rate
- Numerator: dispatchers with at least one route_assigned event that day
- Denominator: dispatchers with access to route assignment that day, including those with no events
- Event: route_assigned, sent on server confirmation, with role, region, platform and app version
- User: the signed-in dispatcher account, merged across devices
- Window: calendar day in the company's time zone
- Exclusions: test accounts, internal staff and automated traffic
For the post-release check, compare the registered route_assigned events with the assignments confirmed in the server log or a scripted test run, and review version coverage, gaps and duplicates.
Mind Studios' approach: We write cards like this into the app requirements document before development starts. That way the first cohort after release can be measured right away, and nobody has to reconstruct later what "active" meant.
Engagement per user: key actions, depth and frequency
Engagement per user combines three numbers: key actions per user per week, depth (how many distinct features a user touches) and frequency (active days per week). Compare them across cohorts, because a base-wide average blends power users with people who tried the app once and hides both groups.
How Chapp's funnels located drop-off
In Chapp, funnels built in the analytics showed the stages where users tended to quit the app, and the team looked at how long registration, first invitations and first messages took. Based on that data, we simplified the tutorial screens and moved the requests for access to contacts and notifications to other places in the interface.
A spec like the card above can ship inside your next release, with every event verified in staging before the first real cohort arrives.
Reading the numbers: what each drop tells the product team
Mobile app user engagement metrics are useful when each drop sends the team to a specific check in the product. The causes below stay hypotheses until a funnel, a cohort split or the release notes support one of them.
| Signal | Possible cause | What to check |
|---|---|---|
| Day 1 retention drops for new cohorts | Longer onboarding, earlier permission prompt or delayed first value | Funnel from first open to key action, by app version |
| Session length rises while conversion falls | Users search for what they used to find fast | Search and navigation events, exit rate before the target action |
| Stickiness ratio falls with a stable MAU | Habit-forming feature lost value or reliability for the core group | Key actions per user in long-standing cohorts, recent changes to that feature |
| New feature adoption stays below plan | Users can't find it, or it solves a problem few have | Feature discovery events, adoption among eligible users |
| Uninstalls rise after a release | Crashes, slower startup, heavier app or forced change in a familiar flow | New version's crash-free sessions and startup time, store reviews since release |
| Engagement gap between iOS and Android | Platform-specific bug, missing parity or slow older devices | Same funnel per platform and device class |
Mind Studios' insight: Check the tracking before you look for a product cause. A renamed event, a new SDK version or a consent prompt moved earlier can lower a metric overnight with no change in user behavior.
When several rows point to stability (crashes, slow screens, a parity gap that keeps reopening), the cause may sit in the codebase. A software audit shows whether targeted fixes will move the numbers or whether a deeper rebuild is the better investment.
Where to start with engagement tracking
Mobile app user engagement metrics pay off fastest when you start with three of them, all tied to your key action: one primary metric, one retention checkpoint and one adoption measure. Add more only when a question comes up that these three can't answer.
A first setup takes five steps:
- Write the key action in one sentence that product and engineering agree on.
- Pick the primary metric and two leading ones from the product-type table.
- Add the events, user identity rules and metric cards to the next release's requirements.
- Decide in advance which behavior change the release should produce, and in which cohort.
- Review cohorts weekly and log each release next to the chart.
App engagement data can then show whether the planned change happened in the relevant cohort. This fits naturally into building and scaling a product, where each release gets a metric to check against.
Once the cause is understood, we can build the next release around a targeted change and measure its effect.
FAQ
Which mobile app user engagement metrics matter most for a B2B app?
In B2B, the customer company decides on renewal, so start with signals at the account level:
- Seat utilization: product-active users ÷ paid seats, per account
- Admin activity next to end-user activity, to spot a rollout problem
- Time to first key action for each new account
- Monthly retention per account, next to individual seats
Is a 2.5% engagement rate good for an app?
Before judging 2.5%, find out which formula produced it. In GA4, engagement rate is the share of engaged sessions: those lasting longer than 10 seconds, with a key event, or with two or more screen views. For product decisions, compare the share of session users who completed the key action with earlier cohorts.
What is a good DAU/MAU ratio?
That depends on how often the product is meant to be used. If users complete the key action only on weekdays, weekends pull average DAU down, so the ratio stays below 100% across a calendar month. Set the target from your product's own rhythm, and track its direction by cohort.
How is engagement different from retention?
Retention shows whether users in a cohort completed the key action again on day N. Engagement shows how much they do across the period: key actions per user, depth and frequency. The two can split: a cohort can hold its Day 30 retention while each retained user does fewer tasks, an early sign of weaker value.
How often should you review engagement metrics?
Match the cadence to how fast each app engagement number moves:
- Daily: active users, crashes and release health
- Weekly: retention cohorts, activation and feature adoption
- After each major release: the funnel for the flow that changed
- Quarterly, or after a pivot: whether the primary metric still reflects the key action
Which tool should you use to track app engagement?
Four criteria narrow the choice:
- An event model with properties and user identity that fits your key action
- Raw data export to your own warehouse
- Consent handling and privacy controls for iOS and EU users
- Cost as event volume grows
At the start, free platform analytics plus one product tool is often enough.
Why do Firebase, App Store Connect and your product analytics show different user numbers?
They count different things. App Store Connect reports Active Devices, using data only from users who opted in to share it. GA4 applies event rules that differ by platform, and product analytics follows the identity rules you configure. Time zones, windows and tracking refusals widen the gaps, so compare trends inside one tool and record the definitions in the spec.