There are plenty of metrics for analyzing user engagement. However, you don’t need to track all of them. What user engagement metrics you should track depends on the specifics of your business and the category of your mobile app.
Engagement metrics like the number of items added to the cart and the cart abandonment rate are highly relevant for eCommerce mobile apps but completely unusable for news or social media apps. In turn, for social media apps, it’s better to track the amount of time users spend on a screen and the number of clicks, comments, shares, likes, and views.
It’s hard to overestimate how vital the data from user engagement analytics is for our product managers and business analysts when they need to validate a tech startup idea, calculate unit economics, or revise an existing software solution.
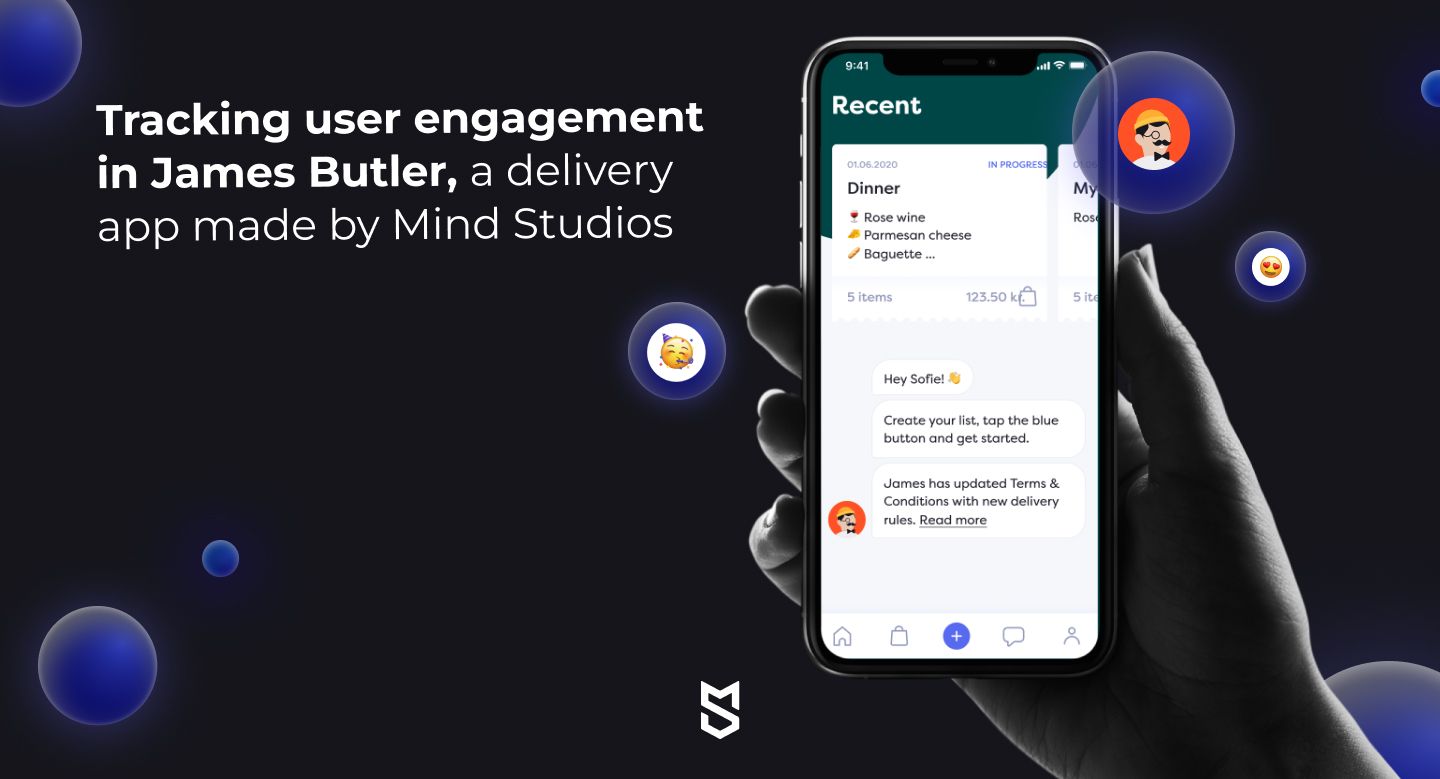
The follow-up upgrades of our delivery app James Butler, for instance, were based entirely on the app engagement analytics, and particularly, on the user feedback. Though James Butler received hundreds of positive user reviews after its launch, our team received some sensible proposals from buyers and couriers on how to improve the app. Those insights gave impetus to developing a unique app feature in the upgraded version, but more on that later.
To lead your mobile app to success — be it an idea in the bud or a fully functioning project — you need to know your user engagement metrics. The question is, “Which user engagement metrics for apps should you track, how to track them, and what to do with the acquired data?”
This article is just about that.
Why user engagement metrics are important
Tracking your mobile engagement score can give you data-backed answers to the most critical questions for your business regarding:
- Acquisition: Where do your users come from and what marketing channels bring the most valuable users to your mobile app?
- Activation: Is your mobile app attractive enough to encourage users to open it? How many users create accounts after downloading your app?
- Retention: Does your app bring users solid value so they return to it? Is your mobile app technically sound or does it have some flaws that drive away customers?
- Referrals: Does your target audience find your mobile app useful enough to recommend it to their friends?
- Revenue: What app features do your active users prefer to spend money on? Does the lifetime value of users justify the cost of attracting them?
It’s worth mentioning that user engagement is subject to the “small change, big difference” rule: Only a 5% increase in user retention (which is one of the core engagement metrics we’ll explore later on in this article) can increase your revenue by 25% and even more.
No less important is to keep your user engagement metrics higher than the market average for:
- Improving your customer loyalty
- Refining your brand’s reputation
- Enhancing your competitiveness
- Reducing your cart abandonment
Top 7 App Engagement Metrics You Need To Track
Now, let’s figure out what user engagement metrics you need to track to measure your app’s performance.
1. Activation rate
After people download an app, they open it — is it always that way? Nope. People can download your app spontaneously because they like your ad's Viva Magenta background — and then forget about it for ages. They can even open your app, bump into a 10-screen registration form, think, "Come on, dude… that's not even good", quit it, and move it to a bin, never getting to know how great your app is.
Being aware of how many users are actually using your app after downloading it is of utmost importance for your app’s success. It enables you to assess your marketing campaigns, improve user retention, and identify the first-coming roadblocks that prevent your new users from engaging with your app.
Activating an app can mean any action new users can take that works well for you: launching an app for the first time, creating an account, completing onboarding, viewing a particular screen, making the first in-app purchase, or subscribing.
You can calculate the activation rate by taking the number of activations compared to the overall number of app downloads:
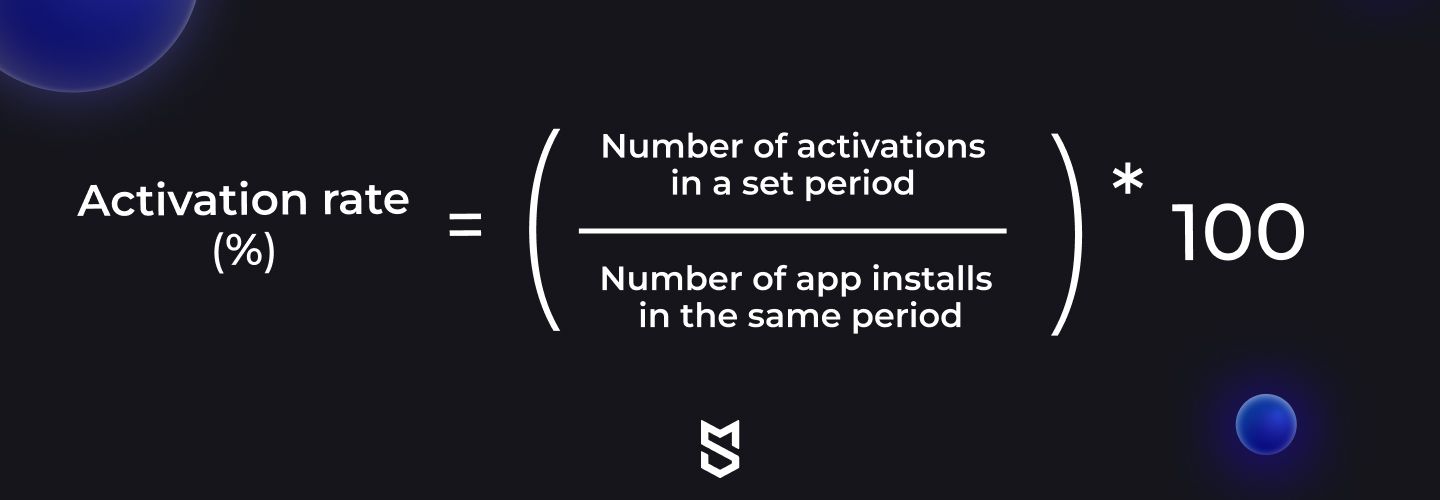
How to track the activation rate: Decide what app event you want to collect information about and set it as an activation event to track for Google Analytics or any other third-party analytics tools like Firebase or Mixpanel.
2. Number of active users
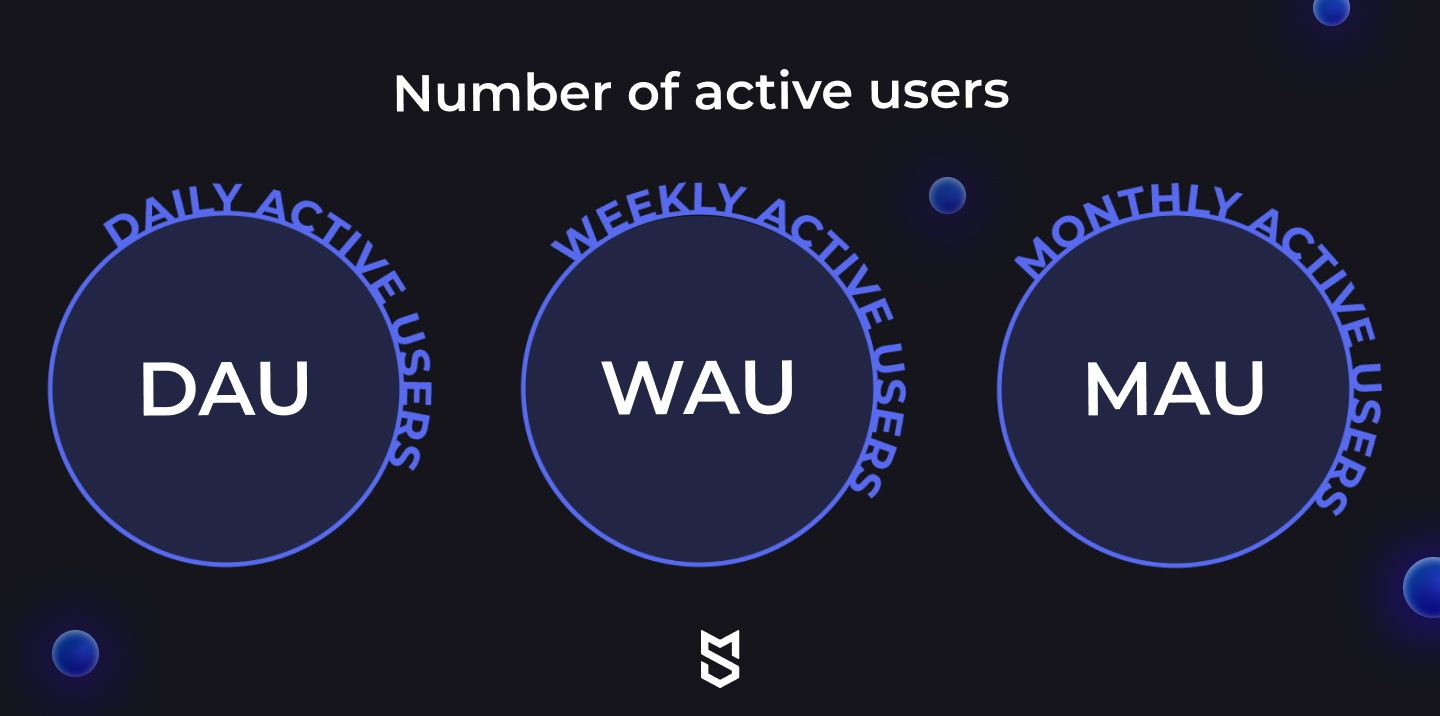
To know how many users use your app after activating it, you can track the number of daily active users (DAU), weekly active users (WAU), and monthly active users (MAU).
Who is an active user? According to the definition from Google Analytics, an active user is a user who has opened your mobile app and performed actions within it in the set time frame (a day, a week, or a month). Users can be called active when they regularly:
- visit your mobile app (for news apps, social media apps, and weather forecast apps)
- generate a certain number of posts, likes, comments, or shares per day, week, or month (especially for social media apps and audio/video streaming apps)
- make purchases (for eCommerce mobile apps)
You should determine what your users need to do to be active according to the specifics of your app.
How to track the number of active users: You can track 1-day, 7-day, 14-day, or 30-day active users with analytics services embedded in the App Store and Google Play Store.
3. Retention rate
The retention rate tells you what percentage of users have used your app more than once in a given period. It can be calculated with the following formula:
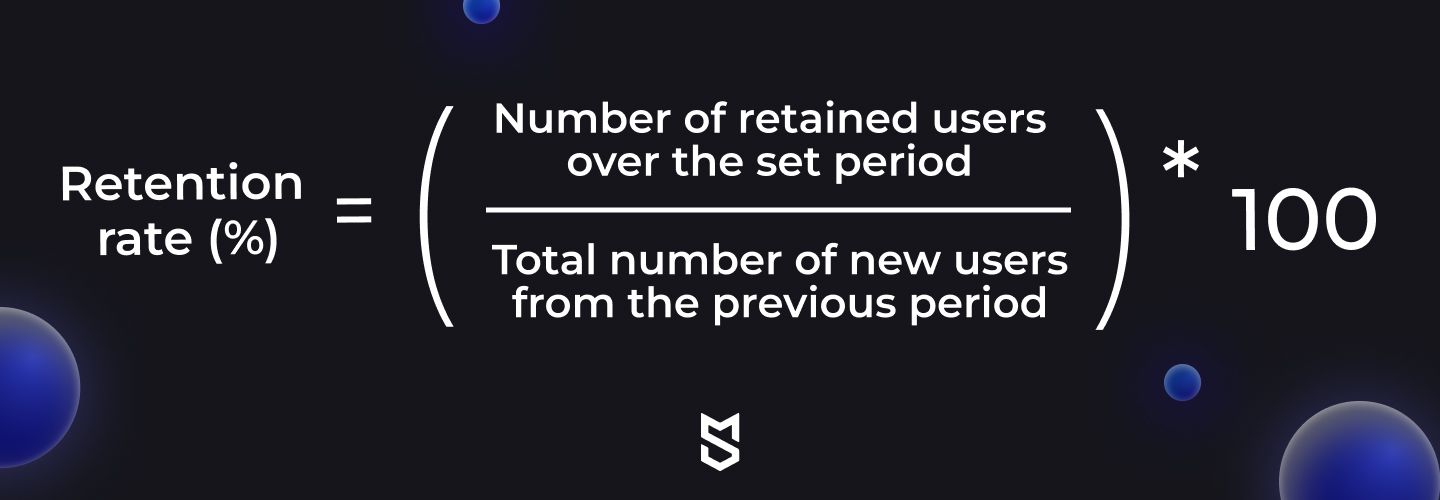
For example, if you received 1,000 new users in January and 300 of that 1,000 returned to your app in February, you would have a 30% retention rate in February for the January cohort.
Your retention rate reflects the effectiveness of your app’s key features in engaging users and making them want to stay with your mobile app for a long time. The retention rate gives you a better look at your target audience: what they like or dislike, what motivates them to come back to your app, and how often they use your app.
Keeping your retention rates high can help you increase revenue over time. On the one hand, repeat users are more likely to make in-app purchases, sign up for subscriptions, or click on ads. On the other hand, you can reduce the cost of acquiring new users, since satisfied users are more likely to recommend an app they like to others.
Retention rates play a critical role for your subsequent app development and improvement. After each of your app's update, you can monitor your retention rate to find out whether your users find a new app feature valuable. According to this feedback, prioritizing which features to develop next will be no brainer for your development team.
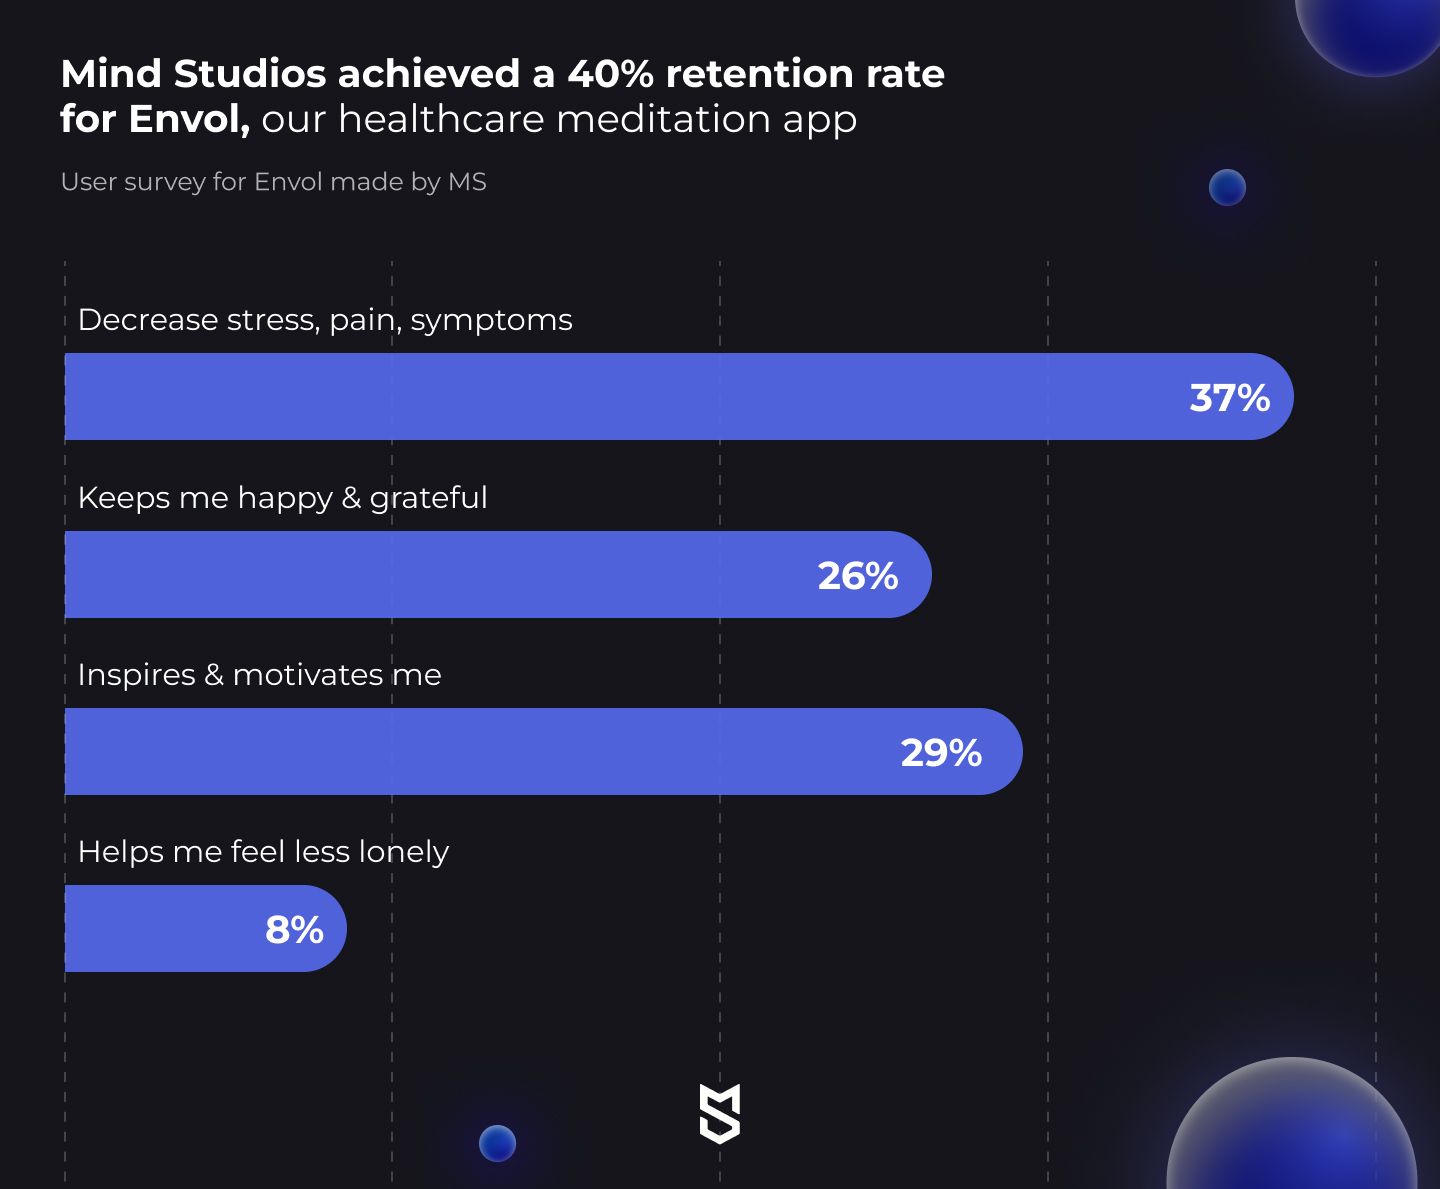
The retention rate for the old Envol app our clients came to us with was too low/decreasing, and it affected the platform's revenue. After we surveyed users and analyzed feedback, we were able to make changes that raised the new Envol's retention rate over 40%.
How to track the retention rate: The retention rate is displayed in App Store Connect and the Google Play Console by default.
4. Conversion rate
Every mobile app owner expects users to take actions like downloading the app, subscribing to the app’s updates, viewing screens, and making purchases. The conversion rate gives you the percentage of users who have taken the actions you wanted them to:
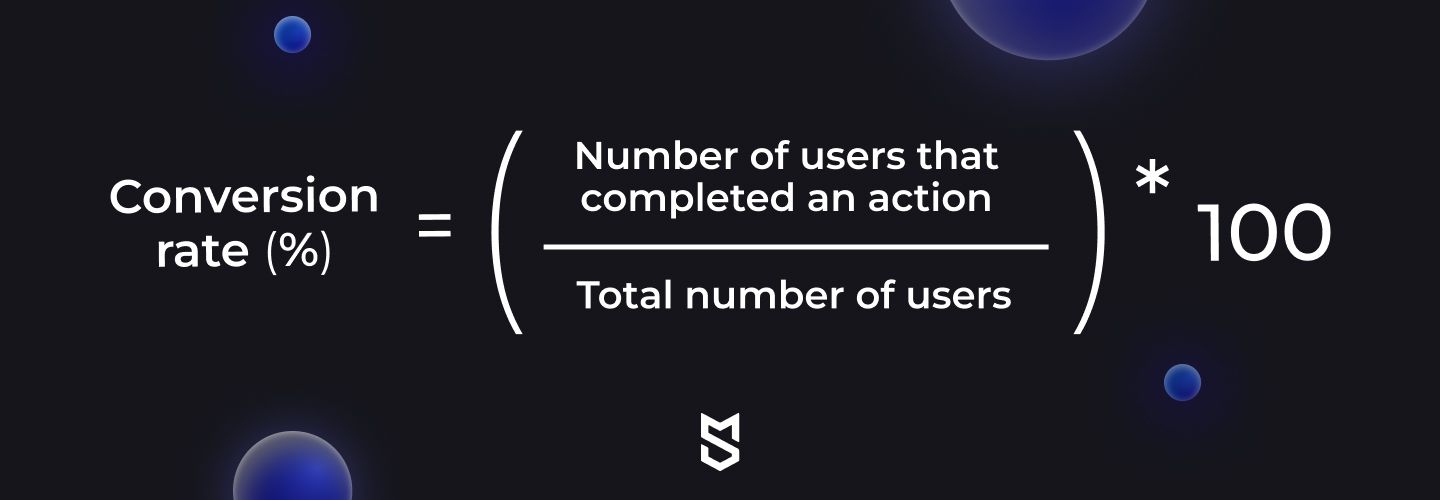
Your conversion rate evaluates your app’s ability to encourage users to complete actions. Knowing the conversion rate can be helpful in defining what app features are most welcomed by your users or testing the adoption of a new app feature.
How to track the conversion rate: You can track the basic conversion rate right from App Store Connect and the Google Play Console, which provide you with the percentage of your app downloads from the app store page. If you need to track other conversions, you’ll need to integrate a third-party analytics SDK.
5. Click-through rate
One more useful metric on your way to learning how to measure app engagement is the click-through rate (CTR). It shows the number of people who click on your ads or links after viewing your engagement offers:
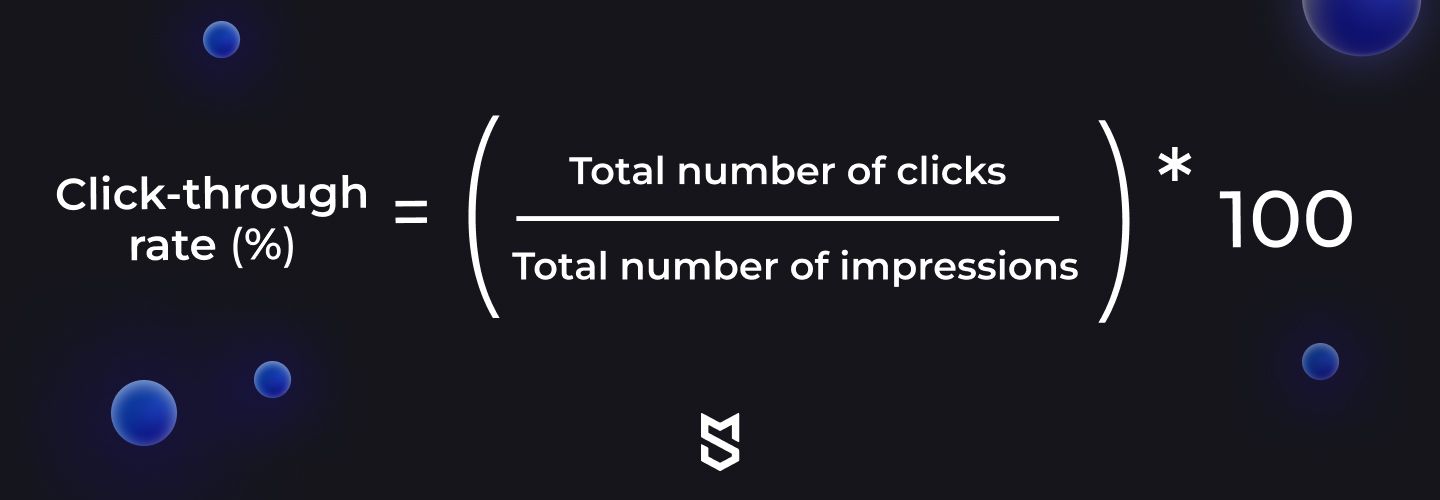
The click-through rate measures the effectiveness of your push notifications, in-app messages, and ad campaigns.
How to track the click-through rate: Use Google Analytics or a third-party analytics platform to customize your CTR report.
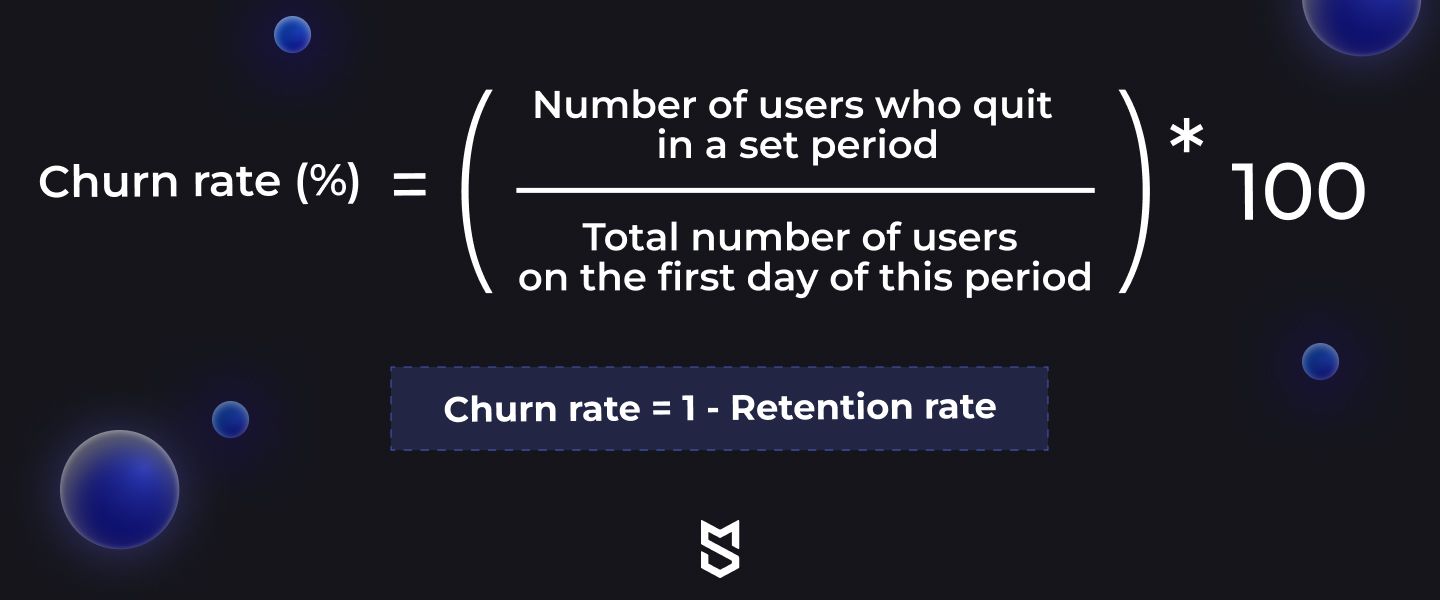
6. Churn rate
The opposite of the retention rate, the churn rate defines how many users exit and never return to your app.
The main aim of determining the churn rate is to figure out what parts of your mobile app cause a negative user experience and work to address those weak spots.
Introducing our secure messaging app MLP to initial users from the Middle East region, we witnessed a churn rate higher than expected. It was found that for those of them who valued the UX and UI design above data security, it was essential to have a messenger with a familiar, Telegram- or WhatsApp-like, interface.
By analyzing the user journey within the app and building funnels, we figured out at what stages our users tended to quit the app — and successfully refined those weak spots to best meet users’ expectations.
How to track the churn rate: Like the retention rate, you can get the churn rate right from your app store analytics tools.
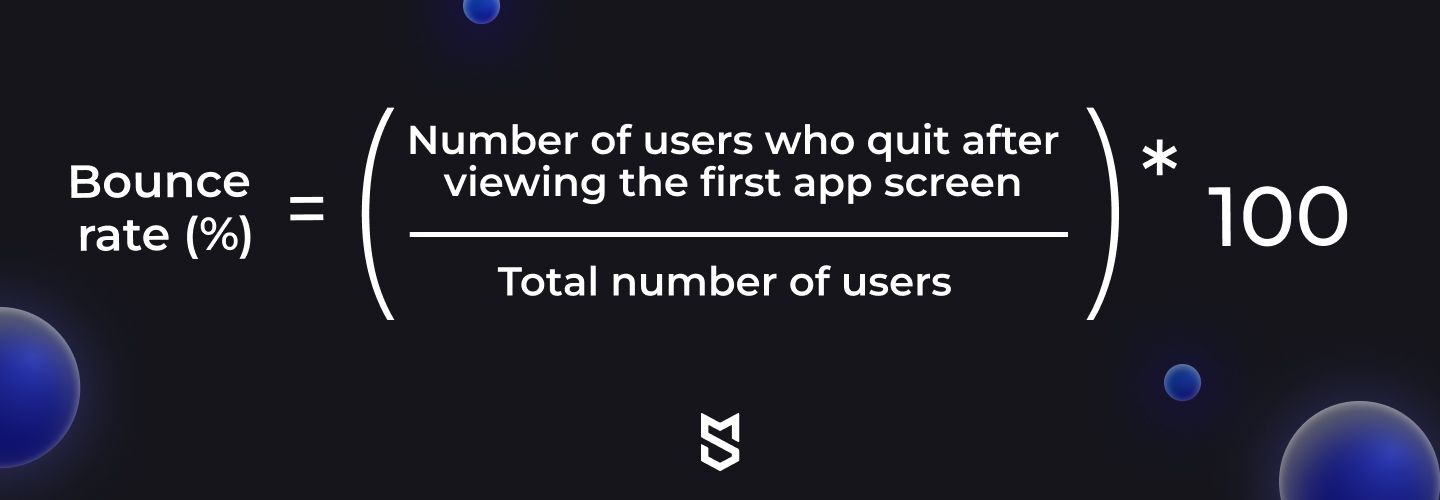
7. Bounce rate
No matter how perfect your mobile app is, there will always be someone who closes your app after viewing only one screen. That is what the bounce rate is about:
The bounce rate works as an indicator of your mobile app’s utility: the lower it is, the more engaging and valuable your app is. But sometimes your users might need to refresh information, thus quickly viewing a particular screen. In this case, your app’s bounce rate can be high while your app is still frequently used.
How to track the bounce rate: You can estimate your bounce rate by adjusting an event type in the Google Play Console or by using a third-party analytics platform.
Tools to track user engagement metrics for apps
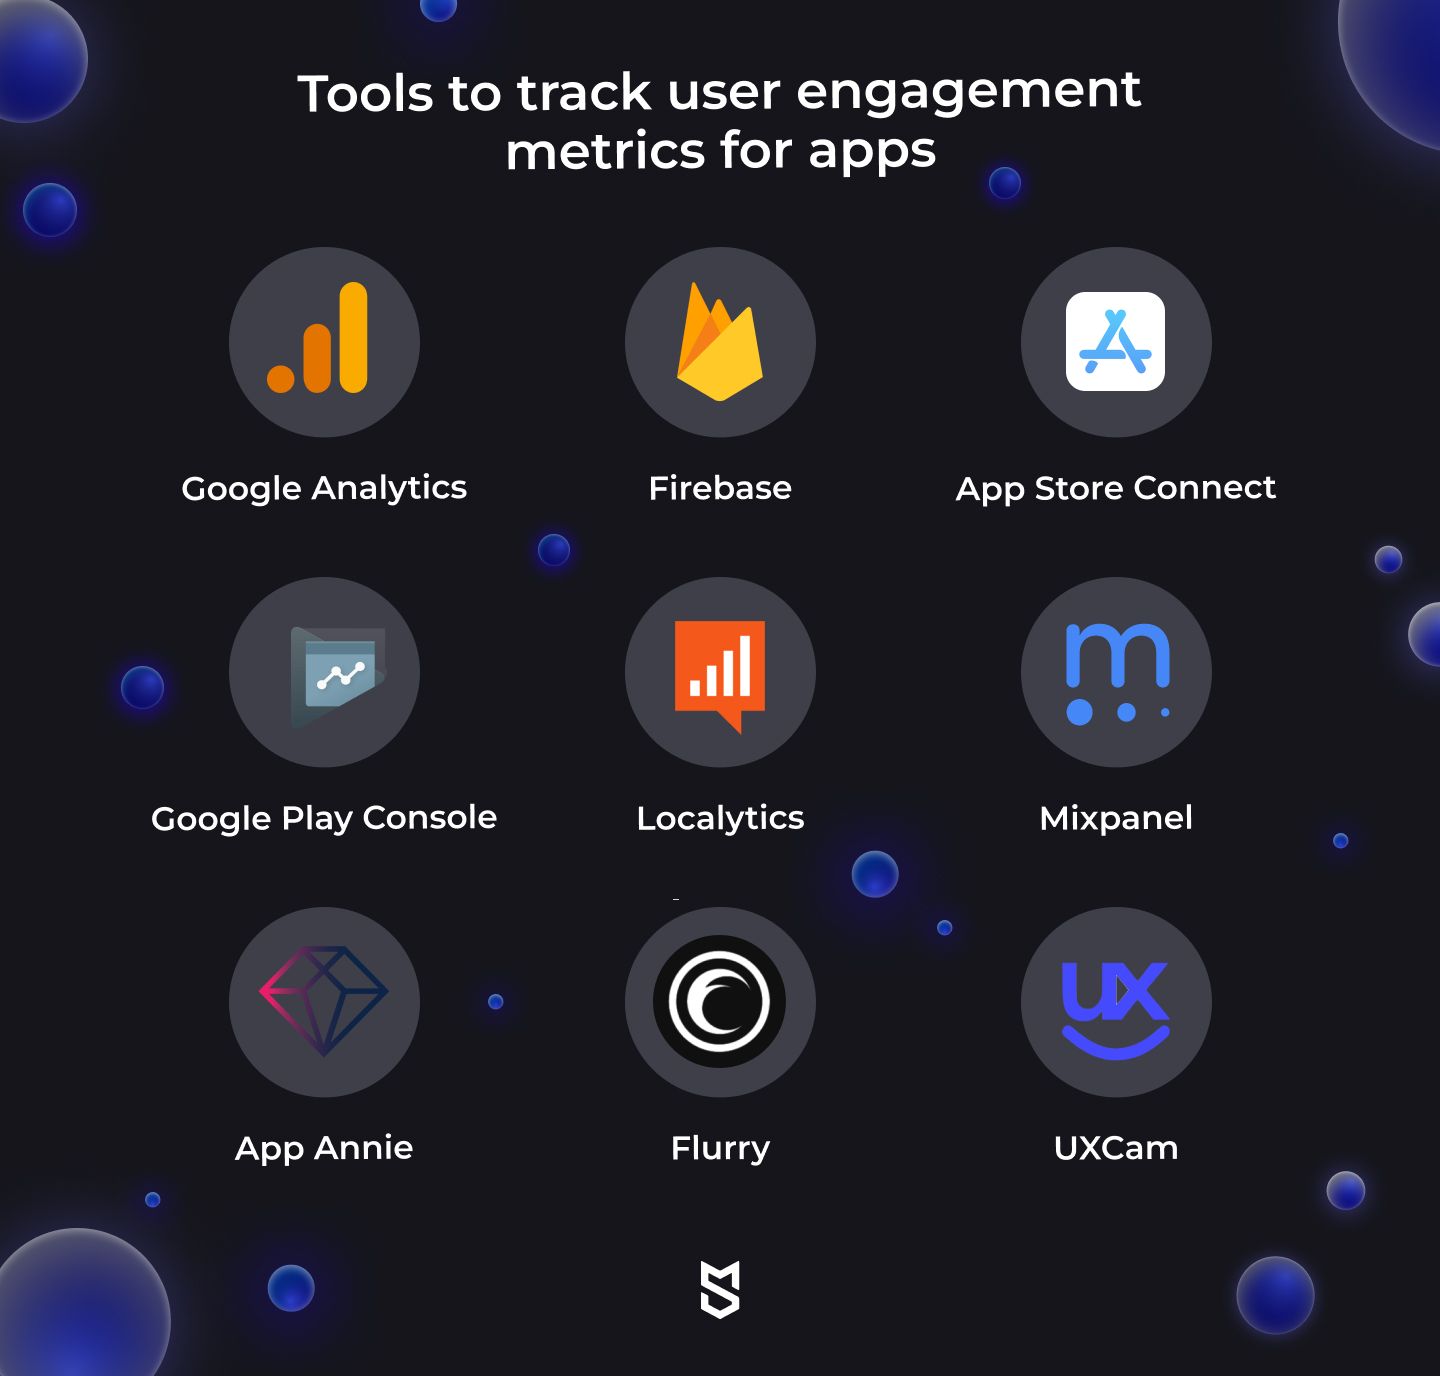
As a mobile app owner, you need to constantly update your customer engagement metrics and monitor users’ attitudes toward your app. Here are eight mobile app analytics tools that can help you measure the top user engagement KPIs so you can optimize your app:
Google Analytics
Google Analytics is the most widely used dashboard-type tool that provides complete, in-depth online analysis of your app engagement metrics both for your website and mobile app. You can use it to track session lengths, conversion rates, app acquisition, churn rates, retention rates, and screen flows. Google Analytics for mobile apps can track poorly performing screens, where users come from (referrers), sales activities, and many other key customer engagement metrics.
Cost: Free; premium version for enterprises
Firebase
Firebase is an all-in-one tool for quantitative mobile app analytics that provides thorough user- and event-oriented reports. Firebase is a Google subsidiary and thus integrates with many Google services, including Google Ads, Google Cloud Platform, and AdMob. Firebase helps you develop mobile apps using many integrated tools: Cloud Messaging, Cloud Storage, Crashlytics, Dynamic Links, etc. You can better customize your user experience in your app using Remote Config, which records certain user activities in your app. You can also optimize user experience by Firebase A/B testing and improve the effectiveness of app notifications sent by Firebase Predictions — a useful tool to categorize users into groups based on predicted in-app behavior.
Cost: Free or paid (paid plans start at $25 per month)
App Store Connect and Google Play Console
App Store Connect, the tool integrated into the Apple App Store, along with the Google Play Console, the analytics service for the Google Play Store, can measure your app store optimization (ASO) and app performance. These tools track app store reviews and major app engagement metrics by separating users into segments. Google Play Console even offers A/B testing for your app icon, description, title, and more.
Cost: Free
Localytics
Localytics is an analytics platform that provides detailed user engagement and retention metrics. It’s aimed at investigating customer behavior, applying intelligent personalization, and attracting users through omnichannel engagement (in-app messages, notifications, ads, etc.).
Cost: Free up to 10,000 MAUs; paid above that
Mixpanel
Mixpanel is a convenient mobile app analytics tool for developers since it doesn’t require any code to track customer engagement KPIs. Mixpanel allows you to choose data points such as devices, channels, and locations; divide users by segments, actions, and funnels; and create custom reports. Mixpanel can also be useful for creating targeted notifications.
Cost: Free for up to 25,000 data points; monthly, annual, and enterprise plans
App Annie
App Annie is a pioneer in the mobile app analytics market with its option to juxtapose market data and company data, providing the most complete app analytics. With the paid version, you can track the number of downloads, revenue, your retention rate, daily active and monthly active users, session duration, screen flow, demographic data, the user journey, and over 12 engagement KPIs.
Cost: Freemium — some features are free; premium and new features are paid
Flurry
Flurry is a platform where you can analyze data on a standard dashboard or create up to 10 dashboards customized for your requirements. Dashboards in Flurry conveniently visualize the conversion rate, user flows, and funnels. While looking at app charts with plenty of data, you can apply filters such as user age, country, first session, app version, and dates for more thorough research.
Cost: Free
UXCam
UXCam allows app developers and designers to replay recordings of user sessions and analyze when and why the app crashes or feature faults appear. UXCam can help you figure out why users leave your app, with funnel analytics.
Cost: Free for one app and up to 2,500 monthly sessions; paid above that
How can you improve app engagement if it's low?
Now that you know what user engagement metrics you should track, the question is, “How can you improve them?”
We’ve prepared 9 effective approaches to improve your app’s user engagement. Some are suitable for every category of mobile app, while some apply only to a certain type of app. You can estimate the usefulness of each approach according to the specifics of your mobile app and test how it works in practice. Let's look at ways to increase app engagement.
1. Use the power of social sharing
According to Think with Google, 51% of smartphone users in the U.S., aged 16–64, get to know about new apps from their friends and family who already use them. So if you have low user acquisition, number of downloads, or number of active users, why not to encourage your established users to recommend your app to their close environment?
For this, adding social sharing features that allow users to share their experiences with your app on popular social media platforms can stand you in good stead.
2. Leverage gamification
One of the proven tactics to increase your core user engagement metrics, such as retention and conversion rates, is to implement gamification. By adding game-like elements like points, badges, and leaderboards, you’ll be able to recreate a more enjoyable user experience and stimulate them to keep using your app.
If you want users to spend more time in your mobile app, open it more often, and enjoy the app experience, you can offer them to participate in a game.
Benefits. Gamification increases user engagement, the number of new users, and an app’s retention rate. It also drives user loyalty, leading to better ratings, more shares, and positive user reviews.
Best practices. You can use different game dynamics to stimulate user engagement:
-
Let users communicate. Support communication among your app’s users to enhance engagement, excitement, and their willingness to win your game.
-
Offer rewards. You can come up with challenges for users and awards for winners. By doing so, you can arouse users’ interest and excitement. The rewards you might offer will depend on the specifics of your mobile app and could be badges, points, incentives, discounts, or something else.
-
Provide a feeling of freedom and power. Gamification empowers users and creates a positive experience with your mobile app. Specifically, gamification can allow users to get a higher status, achieve freedom of self-expression, meet individual goals, move through levels, and get on leaderboards.
-
Use the element of surprise. To re-engage users and make them spend more time using your app, you can organize unplanned challenges and competitions to keep their attention while they wait for unpredictable results.
-
Set rules. It’s much more interesting for users to take part in your app’s games if you set some limits and rules.
Example of effective use. Using gamification, Autodesk achieved a 54% increase in trial usage and a 15% increase in sales clicks.
3. App store visuals
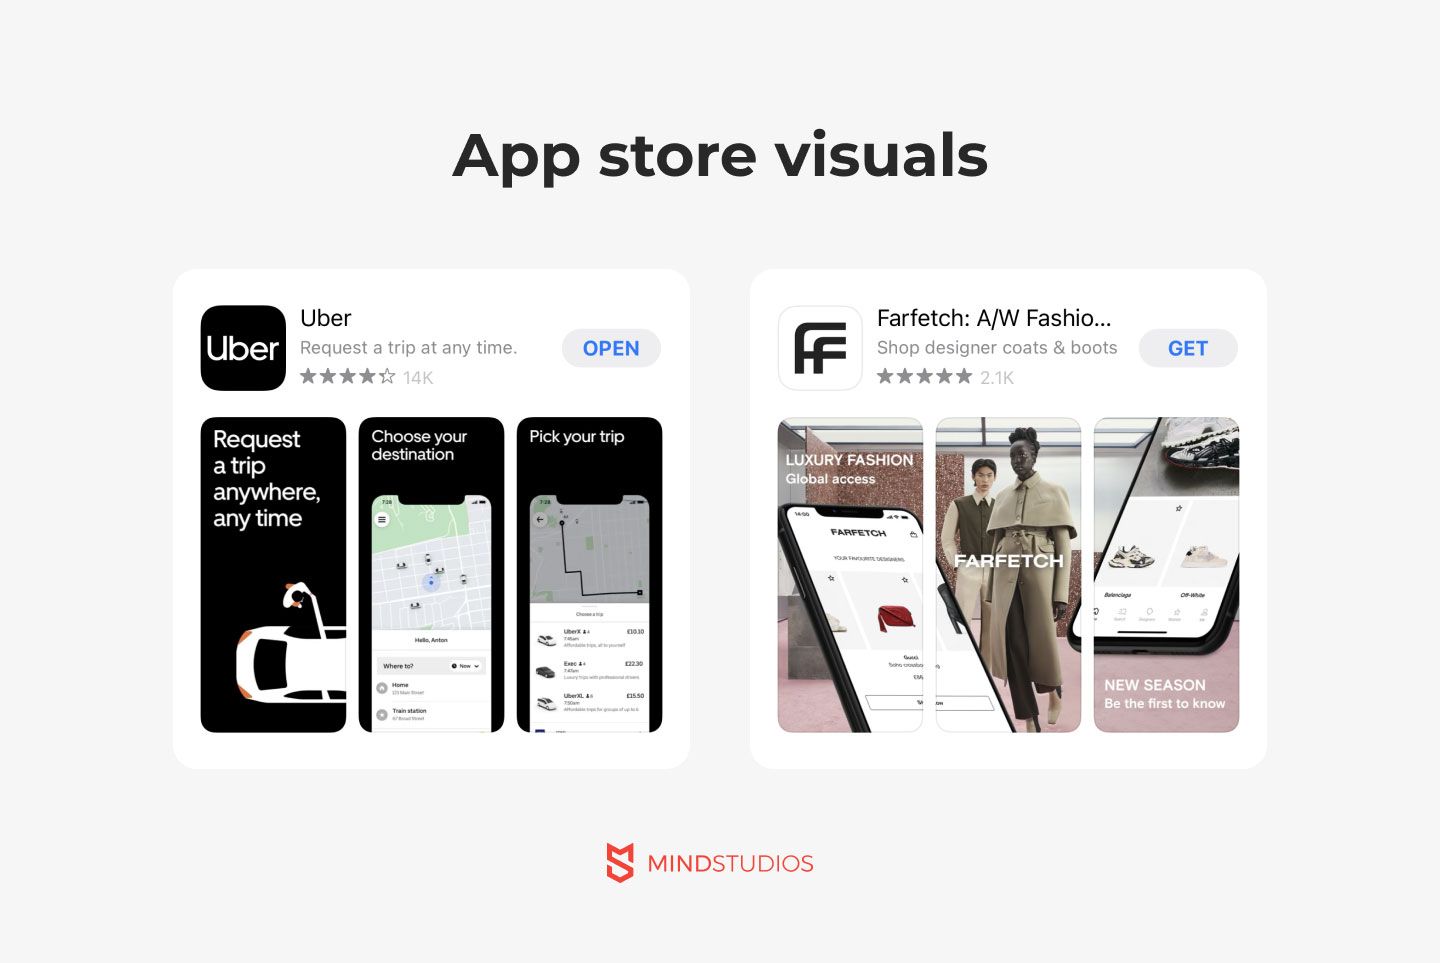
Before tracking your mobile app’s downloads, ratings, and reviews, you need to make your app stand out on the app store. To attract users and get them to give your app a go, you’ll need an optimized app title, an icon, screenshots, videos, and a description.
Benefits. An original icon along with a smart app name, a clear description, and screenshots that showcase the core benefits of your app will improve your app’s visibility on the app stores and enable your mobile product to join the app store leaders. It will also help you achieve sustainable growth of downloads, reduce user acquisition costs, and increase your conversion rate as well as app revenue.
Best practices. The following assets will help you to create attractive app’s visuals:
-
Name. An app's name is the first thing people see. A name can include up to 30 characters in the Apple App Store and up to 50 characters in the Google Play Store. Your app’s name must be readable, unique, and relevant. You can also add keywords. Don’t forget about localizing your app store listing by translating your app’s name into different languages.
-
Icon. Your app’s icon is the first visual that must hook people. So it needs to clearly reflect your app’s nature. You need to develop a unique, stylish icon that matches other elements of your app. But with your icon, less is more. Don’t overload your icon with text, graphical elements, or too many colors.
-
Screenshots allow people to see screens inside your mobile app. Demonstrate your app’s core features in no more than eight screenshots. You can add text to describe features or benefits (discounts, rewards, etc.). You can also experiment with the order of your screenshots, combined in your visual storyline, but it shouldn’t deviate from your app’s general style.
-
Videos. Today, many people prefer watching one short video to reading even just a bit of text. Make a YouTube video about your mobile app and add it to your app’s store page. Moreover, when people watch your Android app video on the Google Play Store, you accomplish two things: you increase your YouTube video views and boost your ranking in the Play Store. You can also localize your video in different languages.
-
Description. Your app’s description is another opportunity to show your target audience your mobile app’s values and benefits. Limited to 4000 characters in both the iOS and Android app stores, a description must include your keywords. But in the Apple Store a description doesn’t impact your app ranking, unlike in the Google Play Store. An informative description with a readable structure (bulleted lists, Unicode symbols, and emojis, for example) will encourage people to download your app. You can also add a powerful call-to-action at the end of your description.
Example of effective use. Per Hagland, the developer of game apps for kids decided to increase the number of downloads of his “Super Puzzle” game. He changed its icon by using the image of a unicorn. The result was incredible: Per doubled the number of downloads.
4. Account creation and sign-up process
To learn more about your users’ behavior and be able to reach your target audience, you’ll likely need to add a registration form to your app’s onboarding process. The main goal of registration is to get users’ contact information as simply and quickly as possible.
Benefits. An efficient sign-up process improves an app’s conversion rate and, as a result, overall user engagement.
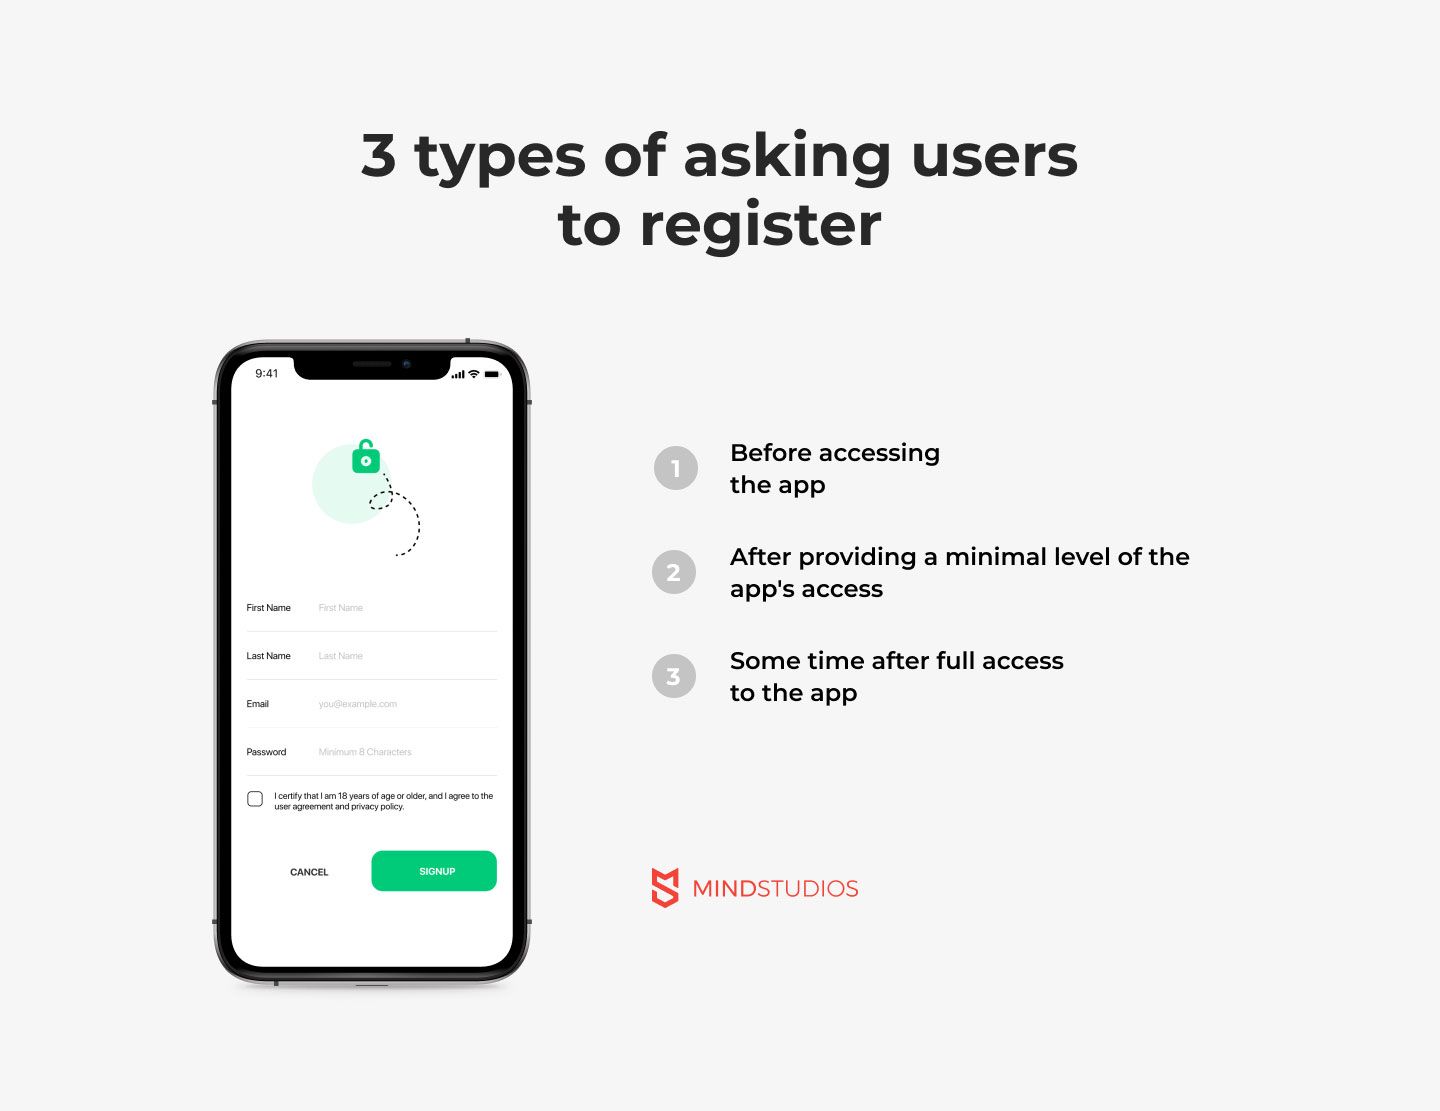
Best practices. There are three approaches to organizing the account creation and sign-in process:
-
Require a user to register before accessing the app
-
Provide minimal level of access to the app before creating an account
-
Allow full access to the app without signing in
The best method for boosting app engagement and retention is to offer a login-free experience to new users. Let them explore your mobile app without any distractions. If they see your app is valuable and appealing, they’ll likely register. Also, to simplify and speed up the sign-up and sign-in process, you can allow users to log in with an existing account, such as a Facebook or Google account.
Example of effective use. Foursquare, a popular mobile app for finding restaurants and other establishments, enables users to get started without registering. A message encouraging the user to sign up with a social media account pops up between app interactions.
5. Freemium model
If your mobile app is paid, it might be difficult to convince new users to pay. The easiest way to increase your product sales is to allow users to interact with your mobile app for free to a certain extent.
Benefits. When users know how your app works, what valuable features it has, and how well it can meet their needs, they’ll be more likely to pay.
Best practices. People like free things, so when adopting a try before you buy approach, don’t overdo it. Make sure to set limits on what users can access for free:
-
Set time limits (for example, a 7-day trial)
-
Offer a limited selection of app features for free while others are paid
-
Let users access functionality for free after completing a particular action (for example, after posting a review or making a certain number of referrals)
Example of effective use. The freemium model brought Rovio Entertainment, the owners of Angry Birds, 50 million downloads in 2018 despite a period of stagnation after the game’s initial launch in 2009. The turning point came in 2015, when Angry Birds 2 was launched with a freemium model. The app was free, but some extra levels and super features were paid.
6. Push notifications
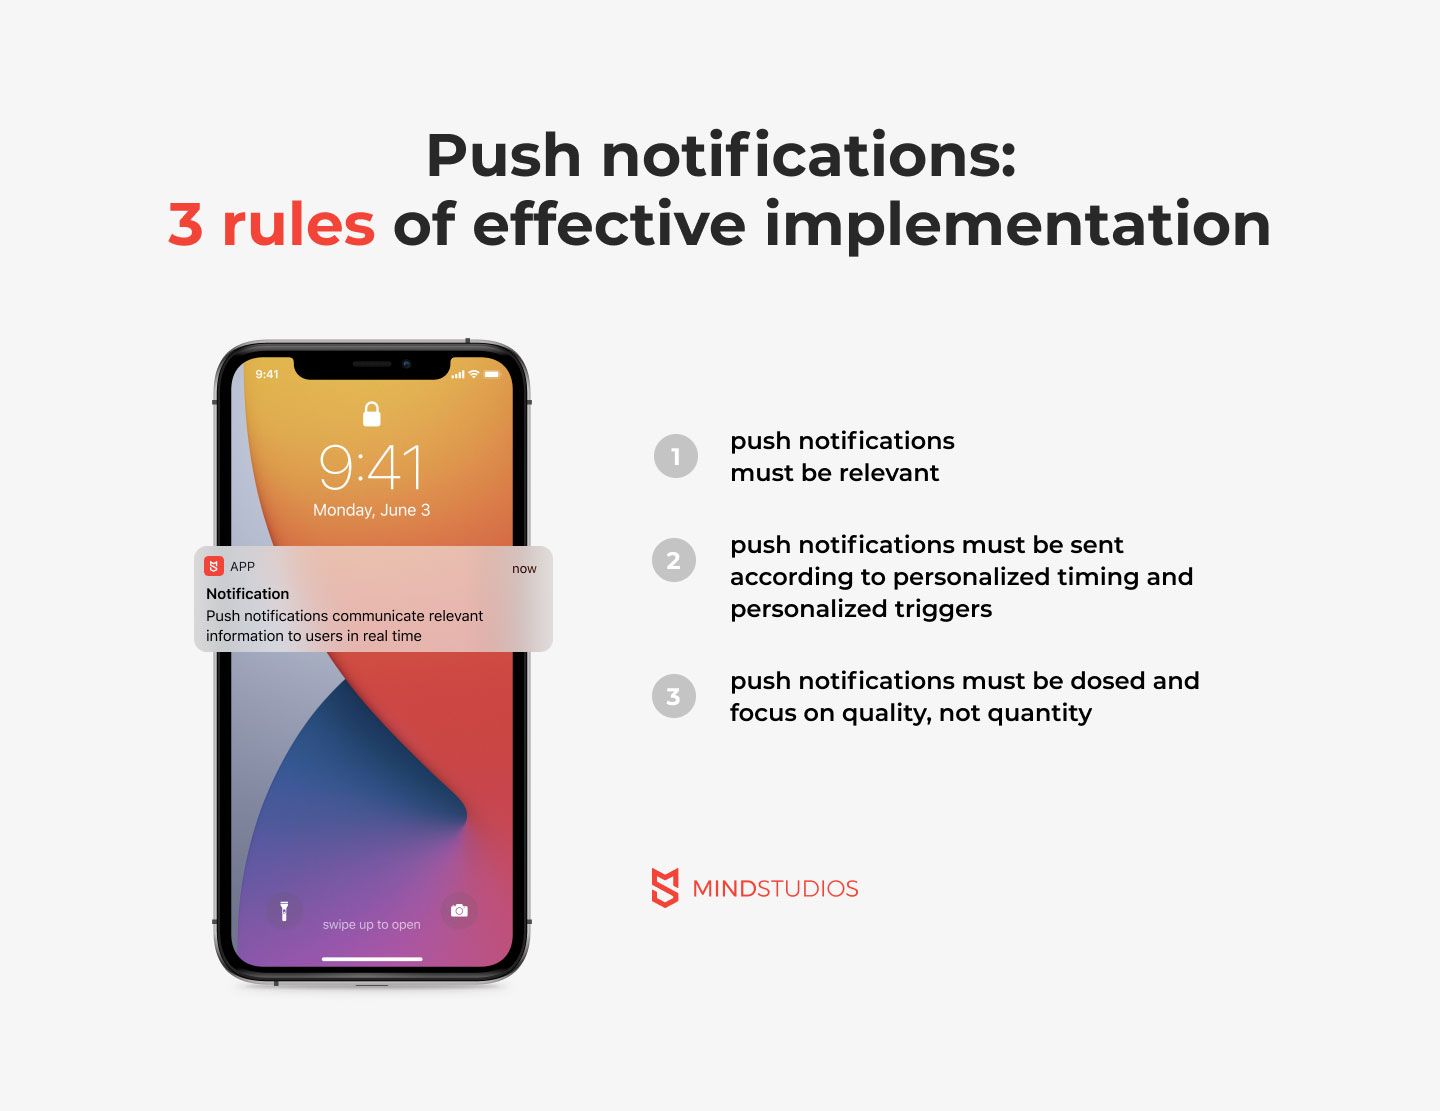
Push notifications communicate relevant information to users in real time whether their device is active or locked. Push notifications are faster than other communication methods such as email. They also don’t get caught in spam filters. Push notifications are a great way to deliver valuable information directly to your users.
Benefits. When provided with valuable and timely content, users become 88% more engaged and your retention rate can increase threefold to tenfold.
Best practices. What makes push notifications effective is that they place relevant information right in front of users, meaning they can’t go unnoticed. You need to define what information interests your mobile app users and share it with them at the right moment. The first rule of mobile push notifications is that they must be relevant for users.
Another approach to get a better effect from push notifications is to send them to a specific person. Identify your users by name, native language, or device type and target them with personalized content. This leads us to the second rule: your push notification strategy must be combined with personalization tactics.
-
Personalized timing. You should send relevant push notifications when users are most likely to use your mobile app. For example, if you have a fitness mobile app and your user prefers to train early in the morning, the most appropriate time to send push notification might be 6:30 am.
-
Personalized triggers. Your push notification strategy can be much more productive for mobile app engagement and user retention if you gather as much data as possible about your target audience’s behavior. For example, say you have an ebook store app and you’ve collected information about your users’ favorite authors. Push notifications about new book releases by these authors will likely boost retention.
In addition, you should adjust how often you send notifications to your target users. If push notifications come too often, this may annoy users and make them uninstall your mobile app. If you send push notifications too rarely, your users may abandon your app. This brings us to the third rule: push notifications must be dosed and focus on quality, not quantity.
Example of effective use. In 2016, eXtra Electronics, one of the leading electronics and home appliance retailers in Saudi Arabia, boosted user re-engagement by 400%, achieved a 12% click-through rate, and doubled their sales using push notifications.
7. In-app messages
While push notifications mostly hook people who aren’t active in an app at the moment, in-app messages pop up while users interact with an app. In-app messages can guide users through app screens, help them accomplish tasks, point out important mobile app features, or thank users for making purchases.
Benefits. With in-app messages, you can share information with your users without needing them to opt in, which they must do to receive push notifications. With in-app messages, you can also create extremely personalized campaigns. An excellent UI with useful messages that pop up at the right time can help you to cut the user’s path from the first launch to taking conversion actions you’ve planned for them.
Best practices. You can use six types of in-app messages to increase customer engagement:
-
Welcome messages. You need to make a good impression during the first launch to form long-term relationships with your target users. The first time a user launches your app, you can send in-app messages with simple instructions on how to navigate your app and an overview of its core features. You can motivate users to log in, complete registration, update their profiles, or permit push notifications.
-
App feature messages. The goal of app feature messages is to familiarize users with your mobile app’s functionality and ensure they have a valuable user experience. In-app messages can showcase your app’s new or underutilized features, services, products, or content.
-
First-time conversion messages. The goal of these messages is to encourage new users to complete their first conversions. For example, you can offer a discount on a first purchase.
-
Promotional messages can be used to promote offers, discounts, cross-sells, etc. The goal of promotional messages is to increase user engagement, especially regarding conversions and revenue.
-
Recommendation messages. Based on the history of your target users’ behavior and their current preferences, you can send personalized in-app recommendations about valuable offers. For example, if you have an app with healthy food recipes, you can offer active subscribers to steamer recipes 7 days of free access to oven recipes.
-
Gather feedback. You can ask your target users to rate features of your app that they’ve just used. The goal is to reveal any bugs and get feedback about the helpfulness of each feature and the overall value of your app for your users.
Example of effective use. In 2019, using in-app messages, Upland Localytics drove their conversion rate up 200%.
8. Deep linking
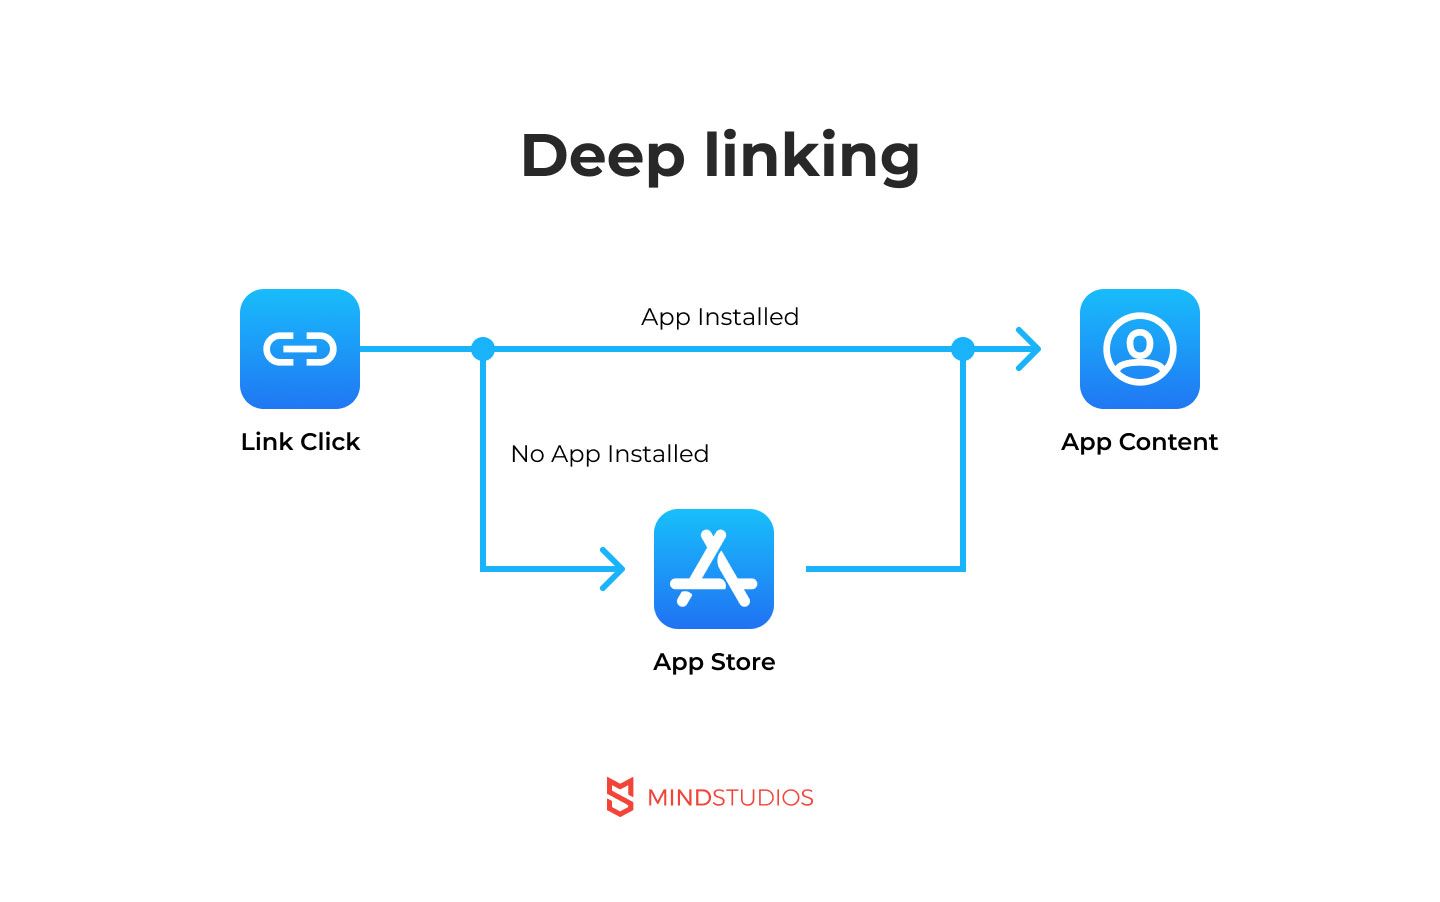
Deep linking sends users straight to a particular screen within your app in one click. You can integrate deep linking into ad banners, emails, or your website to direct traffic to your mobile app, a particular screen in your app, or your app’s page on the App Store or Google Play Store. Deep linking can be used in push notifications and in-app messages.
Benefits. A deep link is like a shortcut, as it sends users directly to a specific app screen instead of to your app’s home screen or a profile screen. Its ability to help users quickly achieve their goals makes deep linking an effective way of boosting app conversions, retention, and revenue.
Best practices. There are three types of deep links:
-
Basic deep links. The main principle of basic deep links is to send users directly to specific content in your mobile app in one click, avoiding a welcome screen. There’s one “but,” however — users who receive basic deep links need to already have your mobile app installed. Otherwise, after clicking on the basic deep link, users will arrive at your website, where they need to click again to come to the App Store or Play Store to download your app. After downloading, users need to open your app where they see your app’s welcome screen, and only after that they can access the desired content.
-
Deferred deep links streamline the user’s path to a particular app screen when the user doesn’t have your mobile app installed. When a user has your mobile app installed, a deferred deep link works the same as a basic link — it sends the user to a particular screen in your app. But with a deferred deep link, if the user doesn’t have your mobile app on their device, after clicking on the deferred deep link, they’ll first arrive at your app’s App Store or Play Store listing, and after they’ve downloaded your app, they’ll automatically be directed to the screen to which the deep link leads. Keep this in mind when planning your app engagement and retention strategy.
-
Contextual deep links are either basic or deferred deep links with additional capabilities to gather information for marketers about the effectiveness of advertising campaigns or user acquisition channels. With contextual deep links, you can provide users not only with quick paths to screens in your mobile app but can know who your users are, where they come from, what their preferences are, etc.
Example of effective use. According to the TechCrunch study among 150,000 anonymized mobile apps’ users, applying deep linking, you can increase your mobile app activation rate by 13%, boost your mobile app retention rate by 50%, and almost double the lifetime of your active users.
9. Make your app accessible for people with disabilities
“We need to make every single thing accessible to every single person with a disability.” Stevie Wonder
To make your app accessible to each user, let’s consider particular accessibility features your app needs.
Benefits. Making your app comfortable to use for people with disabilities will allow you to expand your target audience, increase user engagement, and maximize your revenue.
Best practices. Follow these best practices to make your app accessible to users with different types of disabilities:
-
Visual impairment. Implement a screen reader for visually impaired users. Add screen magnifiers and voice feedback tools.
-
Difficulty hearing. For users who have difficulty hearing, integrate transcriptions or captions into your videos and apps. You can add vibrating and visual alerts for in-app messages, push notifications, or incoming calls.
-
Motion disability. Set up abbreviations for frequently used phrases or words, and enhance the duration between clicks on your app screens. Your users should also be able to choose the size of buttons or other touchpoints in your app.
-
Low level of literacy. To accommodate users with a low level of literacy, create a simple UX with short, clear sentences and recognizable icons and graphical elements. Also, add voice feedback.
Example of effective use. United Airlines redesigned its mobile app to be more accessible for people with visual impairment. Their mobile app designers enhanced color contrast, made the space between graphical elements larger, reorganized the app screen frameworks, and integrated the screen reader tools. The purpose of United Airlines is to improve its app’s accessibility for more than 250 million Americans who have travel-limiting disabilities.
Mobile app engagement metrics: Conclusion
As a mobile app owner, you’re completely sure of your app’s viability. But the cutthroat mobile app market requires more than just believing in success. You need to make data-driven decisions. To do that, choose the mobile app analytics tools and track user engagement metrics to best meet your business requirements.
Need the help of experts to take your mobile app business to the next level? We’re here to help you!