Whether you’ve developed your game for profit or for fun, you most likely want other people to play it, right? To know if they do — and how much — game analytics metrics exist. In this article, we’ll take a look at the most useful mobile game analytics.
Mind Studios Games has been on the market for quite some time, with our own mobile games as well as while developing and supporting games for our outsourcing clients. We’ve seen our share of good performance metrics and of sub-optimal ones as well. We know how to make sense of these numbers and how to make them better.
If you’re interested in what analytics metrics can show and how to best utilize them to improve your game’s performance, we invite you to read on.
Why should you measure your game performance with analytics?
There are all kinds of answers to this question, some more obvious than others. The most straightforward one is that when you launch a game, you naturally want to know how well it’s faring. Even one-person indie developers submitting their first game to an app store or a platform like Game House will monitor the basics: number of downloads, ratings, and comments.
But basics are rarely enough for success.
The number of downloads can tell you how many people found your game description and screenshots interesting and decided to give it a go, but it won’t tell you how long they played (or if they played at all), whether they uninstalled the game and at what point. So, nothing about how the game itself performed.
On the other hand, comments are, of course, an irreplaceable source of feedback and information on your game’s reception. However, they won’t show you the results of your monetization strategy, for example. Also, ratings and reviews might fall victim to bot and defamation attacks or suffer from other backlash. (Books, comics, and TV shows about game developers tend to use this trope quite often.)
While disregarding the obvious metrics like downloads and comments is not wise, there’s more to game application metrics, more metrics to follow. And those metrics can tell you not only how good your game reception is but also how to make it better. That is, if you know how to apply them.
How to measure your game performance with analytics
A number of useful mobile gaming analytics exist to assist game owners with assessing performance. Here are the main ones to track.
Cost Per Install (CPI) and Lifetime Value (LTV)
These two are the building blocks of mobile game economics. CPI is basically the same as customer acquisition cost (CAC), it’s the money spent to attract users to your game. Good game mechanics, interesting setting, captivating trailer-ads all make CPI lower.
LTV, on the other hand, is the total days an average player spends in a game, multiplied by revenue per day. This metric is slightly more difficult to calculate as it needs to be monitored for each user separately and should ideally be tied to the CPI.
For the game to be considered successful, its LTV needs to be higher than CPI/CAC.
Daily Active Users (DAU)
The most basic metric there is, DAU is the number of unique users that launch your game at least once a day. It’s important to keep in mind the “unique” here — if a user plays your game several times a day they’re still counted as a single unique user.
At the same time, DAU is a volatile metric, which means it shouldn’t be your main when assessing game performance. DAU can spike with a good marketing or a user acquisition campaign. It can be a great starter metric to track, though.
Usually, DAU tracking is heavily used upon launch or major update, and after marketing campaigns. Other times, it’s a background metric used to check how “healthy” the overall situation with your game is.
Monthly Active Users (MAU)
MAU is a broader look at DAU — the number of unique users who launch your game during a span of 30 days. It shows the general size of your audience.
Comparing DAU and MAU to the number of downloads might provide you with a rough image of how your game performs compared to your ASO and marketing efforts.
Session length
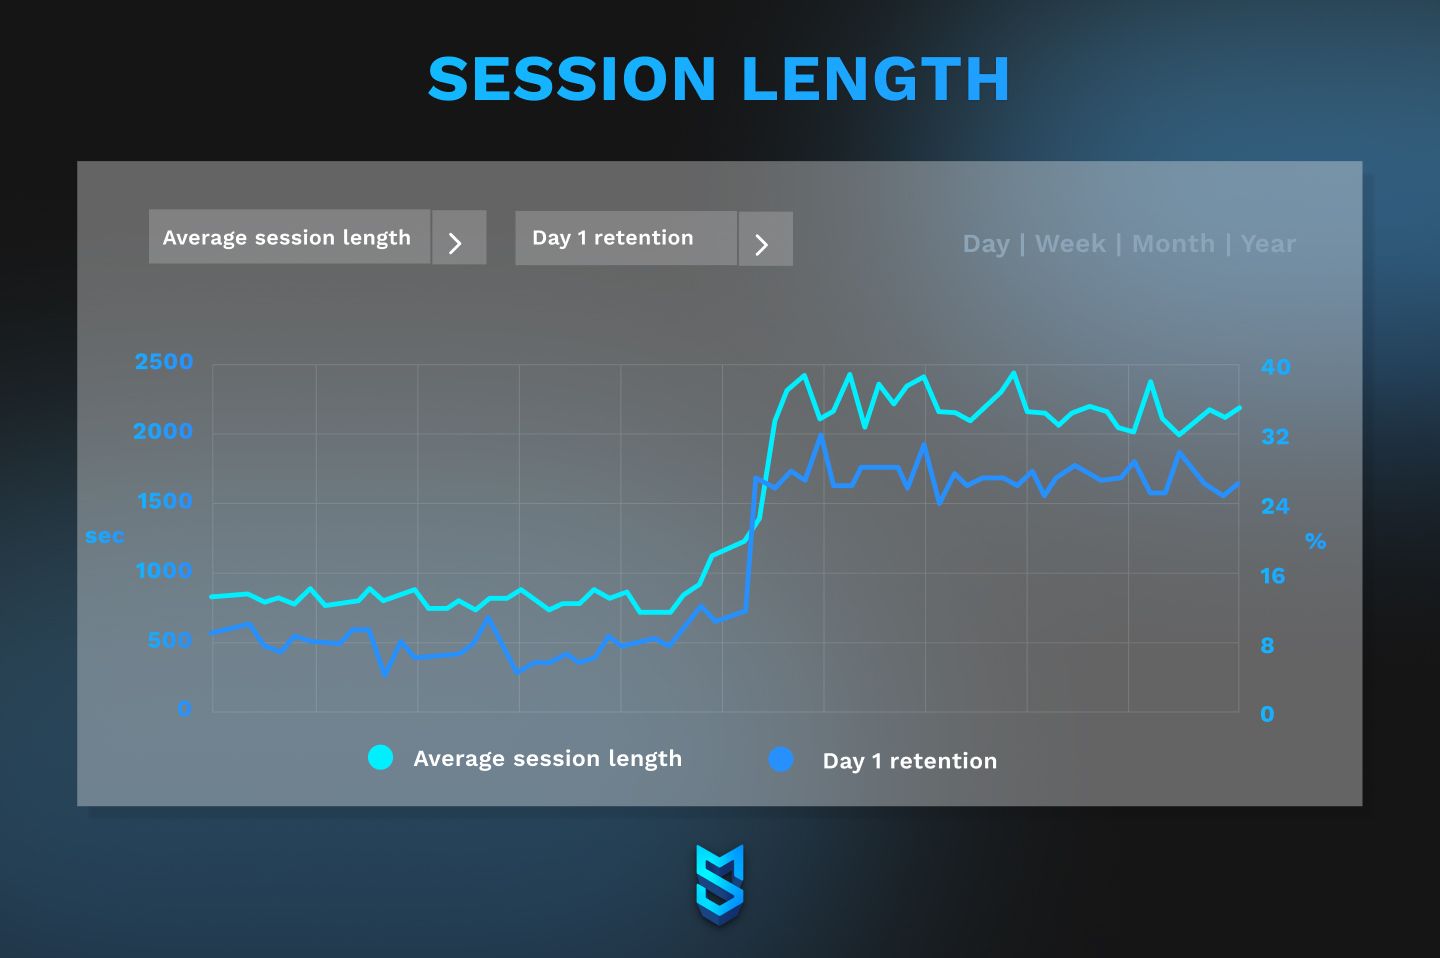
Session length is the average time users spend in the game per opening. There might be multiple instances of opening the game and each of them will count as a session (unlike the number of unique users in DAU/MAU).
Depending on the genre and type of your game, good session length will be different. For example, hyper-casual games are specifically created to have short sessions — people play these games during commute, short breaks, etc. Idle clickers also have short sessions. RPGs and games that involve exploration, on the other hand, usually have long sessions.
Ratio of Daily to Monthly Active Users
We call the DAU/MAU rate stickiness. It’s a metric that shows how often your monthly active users actually open your game. It’s one of the highly meaningful game metrics.
For example, if you track your game’s DAU at 1000 users and your MAU at 1600 users, your game’s stickiness will be 0.625. To see it as a rate, we need to multiply it by 100, which will bring us to 62.5%. This means, an average user opened your game on 18–19 days out of 30.
What’s considered good stickiness for a mobile game? Well, specialists have varying opinions and a lot will depend on your game’s genre, but seeing your DAU/MAU rate at 15–20% is generally a favorable result. If it’s below 7% — your game might be in hot water and you need to review it ASAP.
Retention rate
Retention is one of the most important mobile game performance metrics as it shows how many players play repeatedly, i.e. continue to open your game days after downloading it. A high retention rate means that players see value in your game and there’s a good chance that you can monetize it successfully.
Retention is calculated for each user separately. If the user opened your game the next day after downloading it, they’re retained. Usually, we track this metric for the 1st, 3rd, 7th, 14th, and 30th day (the day of download is Day 0). The ratio between retained and non-retained users is the retention rate.
The D1 retention is the first metric to check on any game’s soft launch as it shows immediate interest of players in your game. If your game’s D1 retention is below 30% that’s not good. Acceptable D1 retention starts at about 45%.
Churn rate
This is a metric that shows how many players (in %) uninstalled your game in a set period of time after installing it.
A churn rate that’s too high means that changes need to be made to something inside the game. Granted, it’s better to have this metric low.
But the thing is, mobile games are among the leaders in uninstall rates, about 95% of players leave a mobile game within a month. The competition is just that high. Even the most successful board and card games, which are considered classic, can have up to 90% in their day-30 churn.
So even if you do see a high churn short-term, do not despair. Use the data to make changes to your game instead.
IAP conversion rate
Conversion rate in general is when a user performs a significant action going through the marketing funnel (e.g. sign up and create an account on a website or in the app). In game analytics, though, IAP conversion is when a player starts making purchases, converting from a free-to-play to paying-to-play.
This metric can tell you how many of your players are ready to pay for your game items and features and, with built-in game analytics, at what point they make such a decision. With this data, you can make improvements to your game’s user experience and monetization.
Ads watched per user
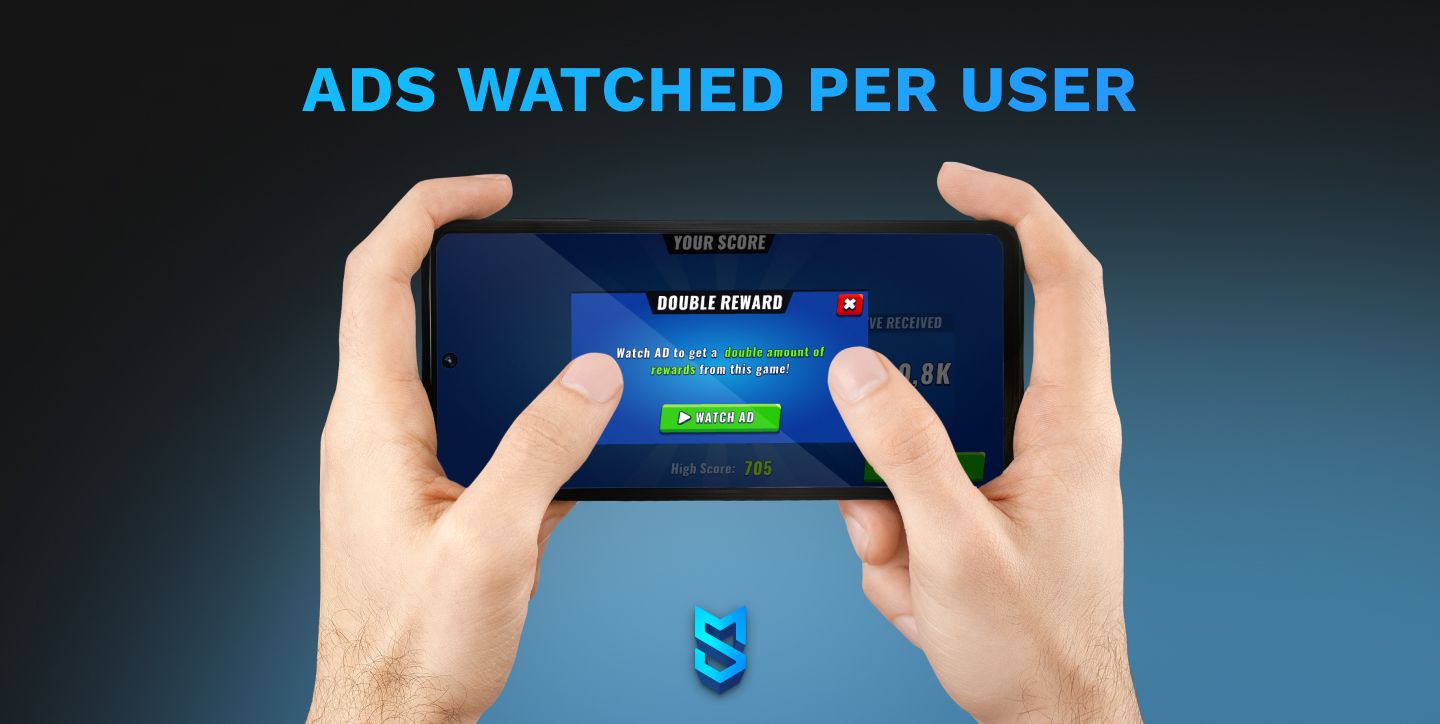
You, as a game creator, want to see how many ads are watched per session and during the lifetime of the user. Based on the game genre, the benchmarks are different, but to make the right decisions, it's good to understand where you stand versus your competitors.
This metric will also provide you insights into ads’ placement, rewards for watching them, and the overall player behavior inside your game (whether their game experience is good enough to endure ads).
Average Revenue Per Daily Active User (ARPDAU)
An important metric for monetization strategy, ARPDAU is your daily revenue divided by the number of your daily users. This metric is usually tracked after important changes to your game, like changing your prices, introducing new game features (especially paid ones), and also after user acquisition campaigns. For the latter, it is especially important since it can help better calculate budgets for future user acquisition campaigns.
Note that if your game gets its revenue from several sources (ads, in-game purchases, subscription to a certain perk like battle passes), for the data to be clean, you’ll need to calculate ARPDAU separately for each of them.
Average Revenue Per Paying User (ARPPU)
If your game has monetization that includes purchases for real money, you’ll need to monitor how many paying users you have and how much they spend on average. This will show you whether your monetization strategy is survivable and how to adjust it for better results.
Source and Sink
These are two metrics related to in-game currency. Source is the point where players obtain whatever spendable resources in the game, and Sink is where they spend said resources. Monitoring these two points will allow you to build a balanced system where players have enough resources to keep playing comfortably but not too much to find the game boring.
In-game purchases
One of the most straightforward mobile game metrics, it actually is more than it seems.
Firstly, you need to know that in mobile games, not only purchases with real money count as in-game purchases. If your game has an in-game currency players can earn by completing missions, spending that currency is also considered in-game purchases. And you need to track them as well.
In-game purchases with in-game currency show how your game performs in terms of mechanics (how easy it is to earn and spend in-game currency) and in-game pricing.
Heat maps
Heat maps are a game analytics tool that can show developers player behavior inside the game. Essentially, with a heat map, you can track the points in your game where the players get stuck, die, or just exit the game (end of session or when they quit for good).
This method isn’t useful for all types of games but if it is for yours, it’s a tremendous source of information for game improvement.
A/B testing
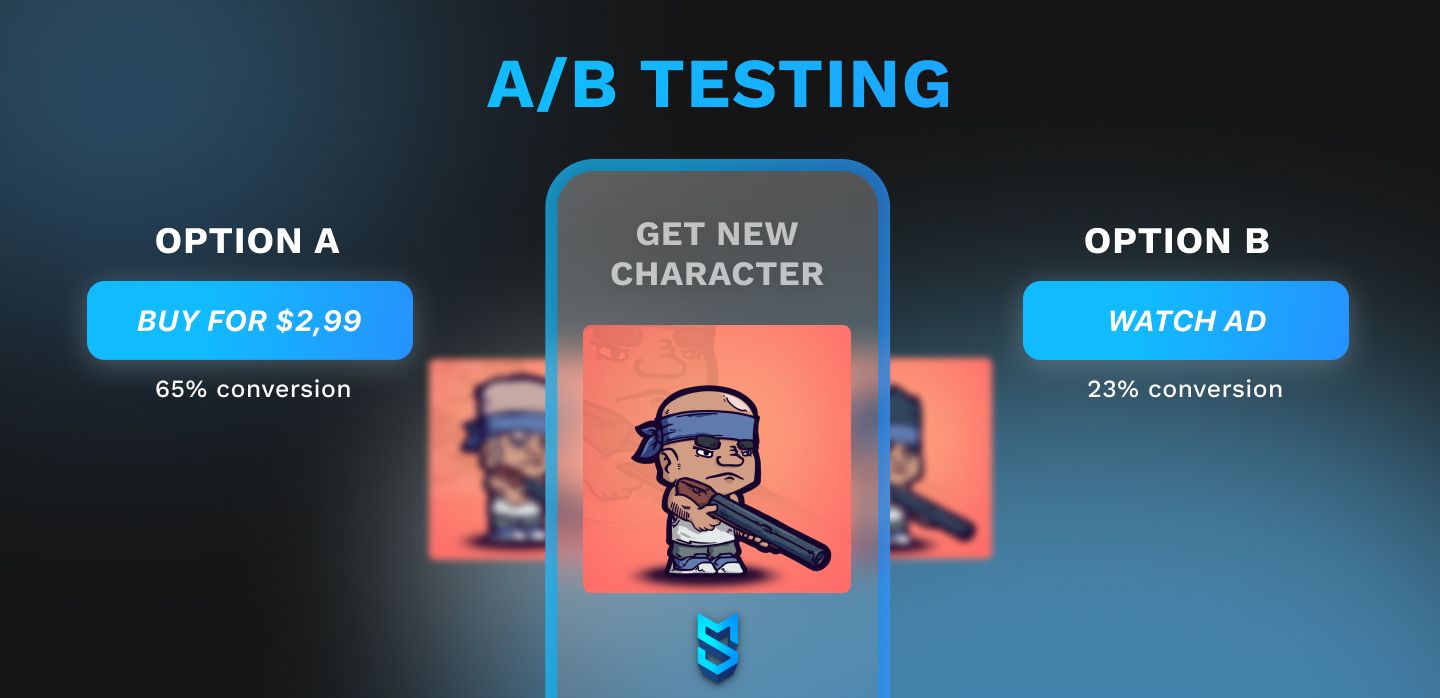
One of the best opportunities to assess game performance is to launch A/B tests. Google Play Store has tools that allow developers to launch updates not for all users but to a part of them. By doing so, you can, for example, launch two variations of an update for two different groups of users and see which one performs better. Or you can launch a single update for some percentage of users and see if the game performs better with the update or without it.
Crash reports and player feedback
The last but not least important (arguably, even the most important) among the game analytics metrics, this is the data that can help game developers better understand the game’s audience.
Even when you dedicate ample time for testing during your game’s development, it’s hardly possible to foresee each and every possibility of crash. Moreover, you can’t test your game on all existing devices, that would take a tremendous amount of time and money. In-game crash reports will provide technical data for a variety of devices your game is available on.
User feedback, on the other hand, will offer you exclusive insights into your players’ minds. You’ll be able to learn, in no ambiguous terms, what exactly players expect from your game. You can’t overestimate this source of data.
Tools for measuring mobile game analytics
Obviously, you won’t be manually counting the revenue each of your thousands of players brought in. There are special tools for that. Generally, we divide such tools into two categories: built-in and external.
Built-in game analytics tools
Most popular game engines have the option to build in analytics. We build mobile games with Unity, and this game engine has an in-game analytics tool as part of their Unity Gaming Services. With it, you can track some of the core mobile game KPIs:
- Days a user played in last 7 days
- Total days a user played
- How many sessions a user played in last 7 days
- Platforms played last 7 days (for when your game is multi-platform, which it usually is)
- Average minutes a user played per day in last 7 days
- Total minutes a user played in last 7 days
- Average minutes a user played per session in last 7 days
- Total sessions a user played
- Total real currency a user spent
- Total time a user played (ms)
- Total events sent
- Events sent in last 7 days
- User first seen
- User last seen
- User’s first purchase time
It’s a very convenient tool that allows developers to see important data in a convenient dashboard. It also makes it possible to track specific events you hold in the game.
Additionally, game developers can also build analytics tailored to a specific game’s needs from scratch. We at Mind Studios do that, actually. Custom analytics allow prioritizing metrics and setting up requirements based on the scale of your launch, which makes analysis easier and more effective.
External game analytics tools
For mobile gaming analytics that can’t be tracked via built-in tools, there’s a wide range of services on the market that offer such services with API integration. Both Apple App Store and Google Play Store offer their own analytics tools for apps and games published there; some of the analytics there are free.
Other popular names in the game analytics market include Firebase, AppsFlyer, Kochava, CleverTap, Flurry, Data.ai (formerly AppAnnie), Smartlook, devtodev, and GameAnalytics.
How to interpret your game analytics
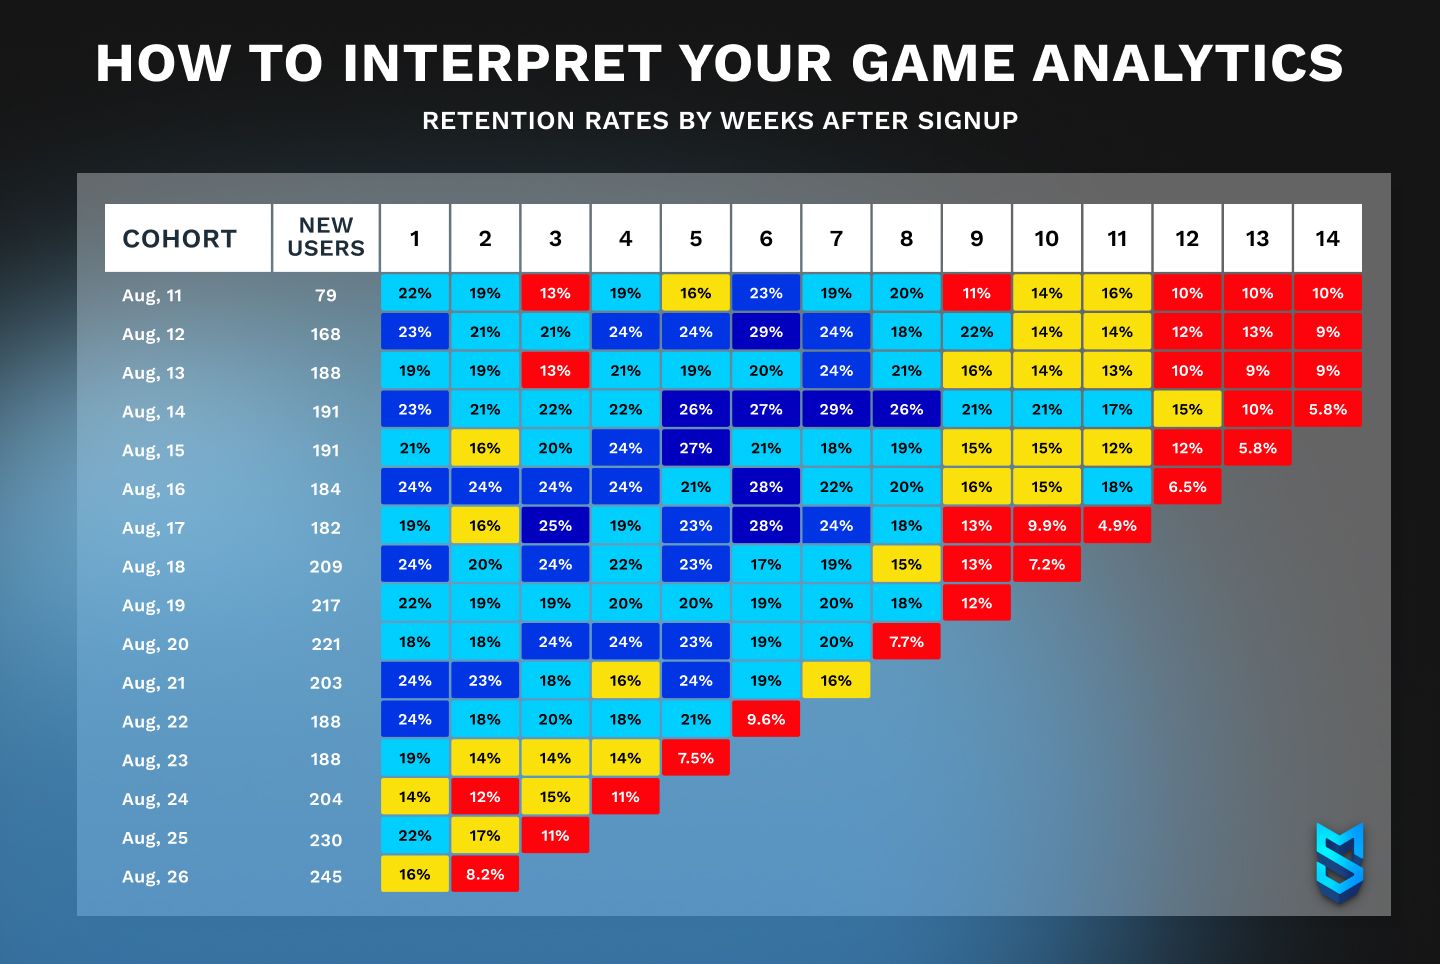
The reason analytics exist is to help developers improve their products. But to do that, you need to understand what mobile gaming metrics will be of use and how.
To properly interpret analysis data, you’ll need to segment it and divide it into cohorts. Some data will be focused on gameplay experience and engagement:
- DAU
- MAU
- Retention rate
- Session length
- Heat maps
- Crash reports
Other metrics will offer insights into how to improve monetization in your game:
- Conversion rate
- ARPDAU
- ARPPU
- Which rewarded ads are played and which are skipped
That’s segmentation. And then cohorts will work as follows.
For example, in January, you get 100 users download and play the game; this is cohort 1. In February, you have 325 users play the game, out of which 50 are from those 100 you got in January, and 275 are new users; this is cohort 2. And so on. You’ll need to track KPIs for each cohort separately and bind it not just to months but also to any changes you make in the game.
Compare all the metrics you track between cohorts to see the patterns. By combining all the data, at some point it will become possible to predict player behavior trends and adjust game features or hold events for the best outcomes.
Conclusion
Without proper analytics, your mobile game will most likely lose to competitors quickly. After all, mobile gaming is a niche where each type of game has dozens, if not hundreds or even thousands, of competitors.
Analytics aren’t always cheap but ultimately, they’re cheaper than the loss possibly incurred by their disregard.
To use mobile games analytics for the highest output, you’ll need to consider multiple factors, from your game genre and size to your goal for revenue. Seasoned developers, though, can draw from their experience to make the most out of any analytics data they obtain from a game.
If you’re looking for a team of mobile game developers who can not only build a product but also improve its performance with analytical data, look no further. Mind Studios Games has all-rounded Unity developers, game designers, and product managers who will help you choose proper game metrics, implement them in the game, and use them for the betterment of your product. Contact our team leads for a free consultation where you can ask questions you have concerning game development and analytics.